
Issue Brief by Senior Policy Analyst, Cody Allen | callen@csg.org
DOWNLOADIntroduction
Of the more than 100 Historically Black Colleges and Universities (HBCUs) in the U.S., the vast majority (85 percent) are in the CSG South region — including the top five states for HBCUs: Alabama, Georgia, North Carolina, South Carolina, and Texas. The CSG South region is the only region in which every member state hosts at least one public HBCU. Given this, it is no surprise that, in this rapidly changing digital economy, a bipartisan effort has begun to examine the critical role of HBCUs, as more than 25 percent of Black STEM graduates come from such institutions. Recognizing this important role, the White House signed an Executive Order in 2025 directing the United States Department of Education to work with private-sector employers, educational associations, philanthropic organizations, and other partners to increase HBCUs’ capacity to provide the highest-quality education to an increasing number of students.1
In 2023, North Carolina set a precedent by establishing the first state-level HBCU Caucus, a bipartisan and bicameral effort focused on meeting the needs and expanding the opportunities of these institutions. More recently, in 2024, Georgia legislative leaders toured the state’s HBCUs to gain insights into the opportunities they offer (particularly in rural areas) and the unique needs they face.2 Given the Biden Administration’s report on the underfunding of these institutions back in 2022-2023 — as well as the financial support for HBCUs provided during the first Trump Administration via the FUTURE Act — member states may continue examining the role of HBCUs in workforce, economic, and educational outcomes and highlight their diversity, particularly as these initiatives enjoy bipartisan support in key CSG South states like Alabama, Georgia, and North Carolina.3,4 Given the importance of these institutions to their host states, this CSG South Issue Brief focuses on public HBCUs in the South and on state efforts to support them; however, in many cases, limited public support has also been directed toward private HBCUs.
Unless otherwise noted, data in this brief focus primarily on public HBCUs; however, some national and economic impact measures include both public and private institutions.
FIGURE 1. U.S. States and Territories with Active, Accredited, and Federally Recognized HBCUs
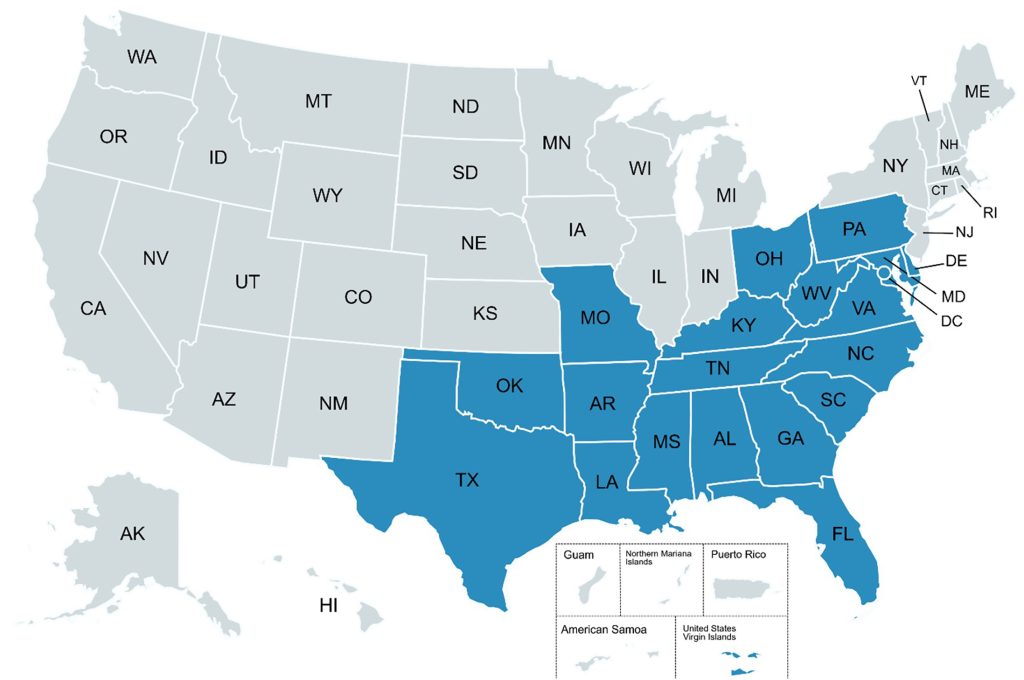
SOURCE: Author’s visualization of data from the U.S. Department of Education (2026).5
The State of the South
TABLE 1. Comparison and Types of Active, Accredited, and Federally Recognized HBCUs in the South
| STATE | TOTAL NO. OF HBCUS | NO. OF 4-YEAR INSTITUTIONS | NO. OF 2-YEAR INSTITUTIONS | NO. OF PUBLIC INSTITUTIONS | NO. OF PRIVATE INSTITUTIONS |
| Alabama | 14 | 8 | 6 | 8 | 6 |
| Arkansas | 4 | 3 | 1 | 1 | 3 |
| Florida | 4 | 4 | _ | 1 | 3 |
| Georgia | 10 | 10 | _ | 3 | 7 |
| Kentucky Louisiana | 2 | 2 | _ | 1 | 1 |
| 7 | 7 | _ | 5 | 2 | |
| Mississippi | 7 | 5 | 2 | 5 | 2 |
| Missouri | 2 | 2 | _ | 2 | _ |
| North Carolina | 10 | 10 | _ | 5 | 5 |
| Oklahoma | 1 | 1 | _ | 1 | _ |
| South Carolina | 8 | 7 | 1 | 2 | 6 |
| Tennessee Texas | 6 | 6 | _ | 1 | 5 |
| 9 | 9 | _ | 3 | 6 | |
| Virginia | 5 | 5 | _ | 2 | 3 |
| West Virginia | 2 | 2 | _ | 2 | _ |
| CSG South Total | 91 | 81 | 10 | 42 | 49 |
Growing support for HBCUs has long been bipartisan and popular in both Washington, D.C., and state capitols across the region. At the federal level, lawmakers created the first Bipartisan Historically Black Colleges and Universities Caucus on April 28, 2015. Three of the four co-chairs of the caucus are from the South — Arkansas, North Carolina, and South Carolina — and the caucus itself is one of the largest bipartisan, bicameral groups in Congress with more than 100 members.7 Not to be left behind, individual states in the South have also joined this movement.
In Georgia, during the 2021 legislative session, a bipartisan group of lawmakers, led by the governor, lieutenant governor, and state legislators, convened the first-ever HBCU Heritage Day at the state Capitol to highlight Georgia’s preeminent institutions.8 Also in Georgia during the 2023 interim, a bipartisan study tour of the state’s historically black institutions led to an op-ed by the lieutenant governor calling for more investment and support for the Peach State’s HBCUs as drivers of economic and civic growth.9 The bipartisan discussion led to the filing of Senate Bill 235 (2024), which proposed creating an HBCU Innovation and Economic Prosperity Planning Districts Commission to examine infrastructure, workforce, and economic development needs and the role HBCUs could play in addressing them. The legislation also proposed investments in infrastructure improvements, such as high-speed broadband, at HBCU campuses. While the bill passed its first chamber, it was ultimately tabled for further study, with leadership committing to continue supporting the growth of HBCUs in the state.11
On February 8, 2023, the Tar-Heel State formed the first-in-the-nation bipartisan, bicameral state HBCU caucus. The North Carolina Legislative HBCU Caucus is modeled after the aforementioned Congressional model. It features four co-chairs — two from each party in each chamber — who each represent districts with an HBCU. Members touted the more than $1.7 billion economic impact HBCUs have on the state as the genesis of the need to form this group.12 More recently, in 2026, the Virginia General Assembly joined the movement by establishing a bipartisan, bicameral HBCU Caucus to examine funding needs, support workforce development, and further invest in the state’s institutions.13 At the same time, the Palmetto State formed its own bipartisan HBCU Caucus, adding South Carolina to the early participants in the state-level movement to create bicameral support for Historically Black Colleges and Universities.14
Enrollment and Funding
TABLE 2. Historic Trends in Total Student Enrollment in HBCUs Compared to All Public Institutions (2014-2024)*
| STATE | FALL 2015 ENROLLMENT (HBCU) | FALL 2024 ENROLLMENT (HBCU) | PERCENT CHANGE (%) | FALL 2015 ENROLLMENT | FALL 2024 ENROLLMENT (ALL) | PERCENT CHANGE (%) |
| Alabama | 29,542 | 31,735 | 7.42 | 194,439 | 202,865 | 4.33 |
| Arkansas | 2,658 | 2,005 | -24.57 | 121,365 | 106,724 | -12.06 |
| Florida | 9,928 | 9,313 | -6.19 | 608,226 | 579,477 | -4.73 |
| Georgia | 10, 988 | 12,858 | 17.02 | 348,844 | 366,748 | 5.13 |
| Kentucky | 1,586 | 2,020 | 27.36 | 154,713 | 139,663 | -9.73 |
| Louisiana | 17,443 | 19,644 | 12.62 | 168,001 | 164,921 | -1.83 |
| Mississippi | 31,761 | 22,018 | -30.68 | 134,694 | 121,925 | -9.48 |
| Missouri | 4,334 | 3,056 | -29.49 | 196,831 | 144,901 | -26.38 |
| North Carolina | 31,659 | 37,037 | 16.99 | 402,199 | 409,585 | 1.84 |
| Oklahoma | 2,543 | 1,937 | -23.83 | 145,401 | 121,543 | -16.41 |
| South Carolina | 4,097 | 3,917 | -4.39 | 174,816 | 175,188 | 0.21 |
| Tennessee | 9,167 | 6,310 | -31.17 | 182,285 | 179,740 | -1.40 |
| Texas | 28,478 | 35,925 | 26.15 | 1,010,936 | 1,044,484 | 3.32 |
| Virginia West Virginia | 9,803 | 11,658 | 18.92 | 318,166 | 296,469 | -6.82 |
| 4,652 | 4,387 | -5.70 | 76,202 | 58,308 | -23.48 | |
| CSG SOUTH TOTAL | 198,639 | 203,820 | 2.61 | 4,239,132 | 4,114,565 | -2.94 |
* Includes both two- and four-year institutions where applicable.
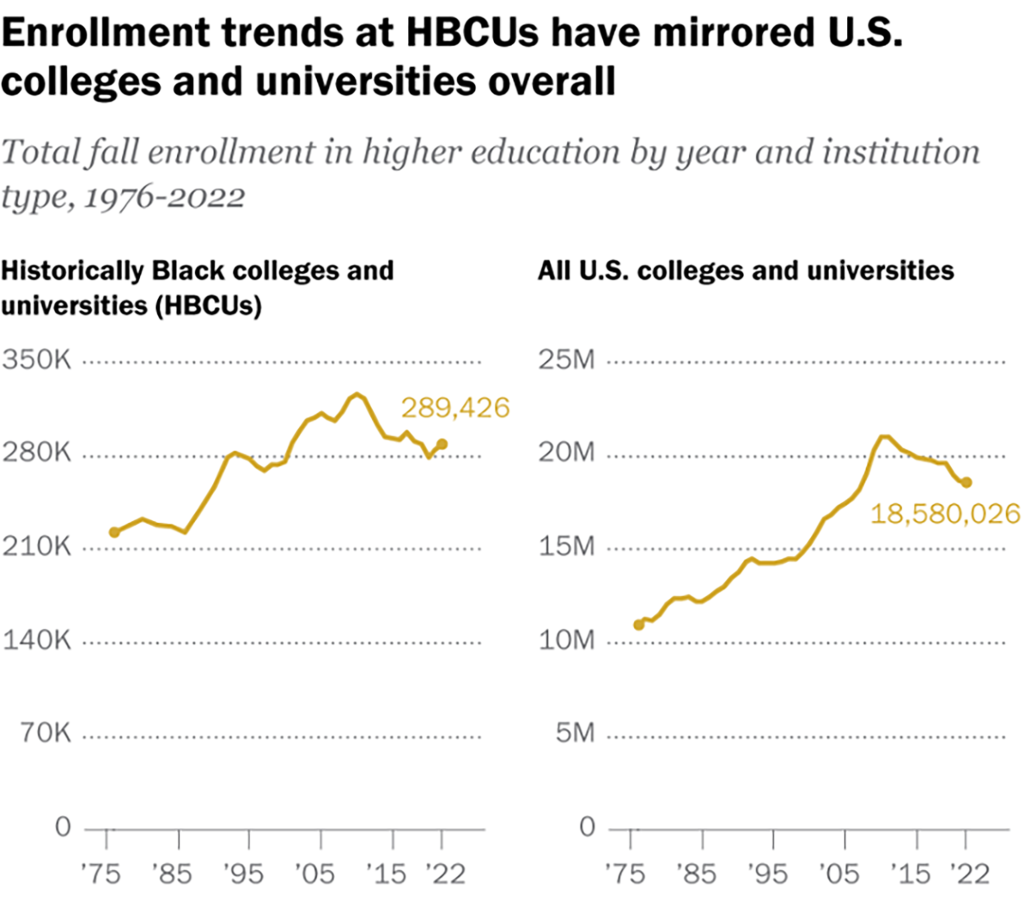
The South — and its HBCUs — have not been immune to the enrollment crisis facing higher education in the past decade. However, as a region, enrollment in public HBCUs increased by more than 2.6 percent from Fall 2015 to Fall 2024. In contrast, total enrollment across all public post-secondary institutions fell by nearly 3.0 percent during the same time period. Notably, states like Kentucky, Louisiana, and Virginia saw total enrollment decrease overall, while HBCU institutional enrollment increased. On the other hand, South Carolina saw overall enrollment trending upwards, but a decline in HBCU enrollees across the Fall 2015 to 2024 period.17
As noted previously, there is great diversity in the number and size of public HBCUs across the South, making an exact comparison difficult. However, as the tables in this section note, it is possible to examine how individual states have, over time, changed their support for, or seen changes in, enrollment across institutions. However, one notable example, from Louisiana, is the Southern University System. The SUS is the only HBCU group organized into an independent system in the U.S. This allows its five campuses to operate more closely aligned with a focused identity, mission, and strategic growth plan.18 In other states, HBCU institutions may be individual members of a larger university system competing for finite funding.
TABLE 3. Trends in State Appropriations to Four-Year HBCUs (2015-2025)
| STATE | FY 2015 APPROPRIATIONS | FY 2025 APPROPRIATIONS | PERCENT CHANGE |
| Alabama19 | $435,904,577 | $545,307,385 | 25.10% |
| Arkansas20 | $27,330,722 | $30,334,284 | 10.99% |
| Florida21 | $164,146,218 | $183,003,427 | 11.49% |
| Georgia22 | $57,783,843 | $92,595,956 | 60.25% |
| Kentucky23 Louisiana24 | $23,429,600 | $21,060,900 | —10.11% |
| $65,159,435 | $98,576,605 | 51.29% | |
| Mississippi25 | $144,356,997 | $151,185,689 | 4.73% |
| Missouri26 | $28,881,707 | $49,357,181 | 70.89% |
| North Carolina27 | $320,351,773 | $475,752,222 | 48.51% |
| Oklahoma28 | $18,765,398 | $19,835,181 | 5.70% |
| South Carolina29 | $19,895,148 | $34,158,601 | 71.69% |
| Tennessee30 Texas31 Virginia32 | $39,211,000 | $70,817,031 | 80.61% |
| $136,240,358 | $161,947,843 | 18.87% | |
| $321,661,687 | $528,678,437 | 64.36% | |
| West Virginia33 | $17,910,539 | $24,850,433 | 38.75% |
| CSG SOUTH TOTAL | $1,821,029,002 | $2,487,461,175 | 36.60% |
Overall, outside of one state, which has only a single public HBCU, every state in the region increased appropriations for its public HBCUs during the decade from Fiscal Year 2015 to Fiscal Year 2025. Further, more than half of all states in the South — 12 —recorded double-digit increases of 10 percent or more over the same fiscal period. For the three CSG South member states with historically black community colleges or two-year HBCUs — Alabama, Mississippi, and South Carolina — appropriations for these community colleges increased by an average of 55.7 percent from Fiscal Year 2015 to Fiscal Year 2025. Importantly, none of these institutions saw a decrease in appropriations during this time.35,36,37 For the entire 15-state CSG South region, state appropriations for HBCUs increased by more than $600 million — or nearly 37 percent — during these 10 years.
Using additional data from the U.S. Department of Education’s Integrated Postsecondary Education Data System, or IPEDS, provides a clearer picture of what these funding measures may mean below the surface. Specifically, the table below charts IPEDS data for Fiscal Years 2014 and 2024 on “nominal” (non-inflation-adjusted) spending per full-time equivalent (FTE) student.38 Furthermore, using annual survey data from the State Higher Education Executive Officers Association (SHEEO), the per-FTE funding of HBCUs relative to total public funding for higher education institutions can be compared. According to a comparison of IPEDS and SHEEO data from Fiscal Year 2014 to Fiscal Year 2024, per FTE state funding for HBCUs increased at a slightly lower rate than the overall increase in state per FTE funding for all public postsecondary institutions. Nationally, the average was $6,675 per FTE in FY2014 and up to $11,826 per FTE by FY2024 — an increase of more than 77 percent and higher than the regional average for both HBCUs and all institutions.39,40
TABLE 4. Trends in Per-FTE State Funding for HBCUs Compared to All Public Institutions (FY2014-FY2024) ✝
| STATE | FALL 2015 ENROLLMENT (HBCU) | FALL 2024 ENROLLMENT (HBCU) | PERCENT CHANGE (%) | FY14 PER FTE FUNDING (ALL) | FY24 PER FTE FUNDING (ALL) | PERCENT CHANGE (%) |
| Alabama | $6,056 | $9,700 | 60.17 | $5,189 | $10,514 | 102.62 |
| Arkansas | $11,671 | $15,593 | 33.60 | $6,607 | $8,919 | 34.99 |
| Florida | $11,358 | $14,052 | 23.72 | $5,489 | $11,107 | 102.35 |
| Georgia | $6,324 | $9,201 | 45.49 | $6,925 | $11,547 | 66.74 |
| Kentucky Louisiana | $14,295 | $20,319 | 42.14 | $6,121 | $8,867 | 44.86 |
| $4,163 | $5,332 | 28.08 | $5,031 | $7,715 | 53.35 | |
| Mississippi | $5,097 | $7,770 | 52.44 | $5,401 | $7,606 | 40.83 |
| Missouri | $8,265 | $15,890 | 92.26 | $5,295 | $8,691 | 64.14 |
| North Carolina | $12,115 | $16,421 | 35.54 | $7,817 | $11,849 | 51.58 |
| Oklahoma | $8,828 | $10,120 | 14.64 | $6,272 | $8,522 | 35.87 |
| South Carolina | $4,029 | $19,734 | 389.80 | $4,377 | $8,773 | 100.43 |
| Tennessee Texas | $5,097 | $10,140 | 98.94 | $6,672 | $12,596 | 88.79 |
| $5,485 | $6,279 | 14.48 | $6,837 | $13,057 | 90.98 | |
| Virginia | $9,006 | $22,426 | 149.01 | $4,771 | $9,830 | 106.04 |
| West Virginia | $4,912 | $7,595 | 54.62 | $4,803 | $6,794 | 41.45 |
| CSG South Total | $7,780 | $12,705 | 63.30 | $5,840 | $9,759 | 67.11 |
✝ Per FTE is averaged across multiple institutions and includes both two- and four-year institutions for those having both. Additionally, some states – such as Arkansas, Florida, Kentucky, and Tennessee – only have one public HBCU institution, which may skew comparisons with other states in the region.
Agriculture and Rural Communities
Acknowledging the strong legacy and impact of agriculture, engineering, mechanical sciences, and military studies in the country, Congress designated select institutions of higher education in the U.S. as land-grant institutions as beneficiaries of the Morrill Acts of 1862 or 1890 and the Equity in Educational Land-Grant Status Act of 1994. Of the 106 land-grant institutions in the U.S., more than 30 are in the CSG South region, including 15 public and one private HBCU.43 Across the South, HBCUs have continued to build upon this legacy by investing in the research, economic, and workforce development needs of the agricultural and rural communities.
FIGURE 2. Map of Land-Grant Colleges and Universities in the U.S. States and Territories
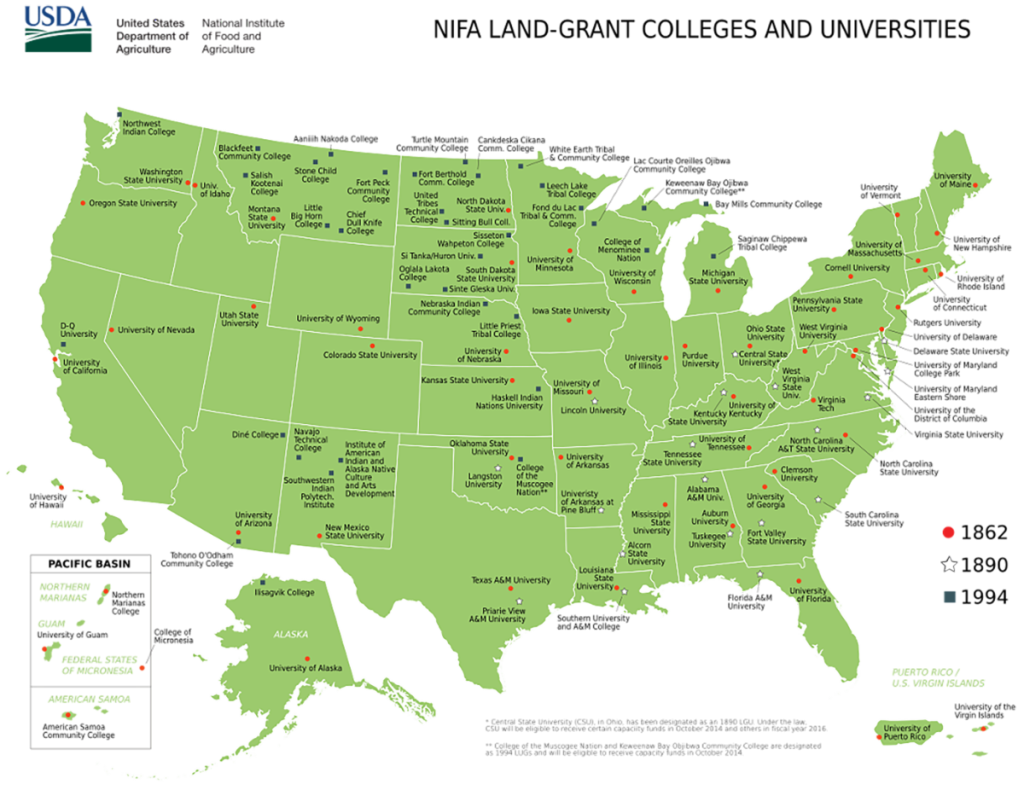
SOURCE. Source: U.S. Department of Agriculture.44
Economic and Workforce Impacts
TABLE 5. Comparison of Reported Economic and Workforce Impact of public and private HBCUs (2024)‡
| STATE | ON-CAMPUS | JOBS CREATED OFF-CAMPUS | INDIRECT** | ADDITIONAL LIFETIME INCOME OF GRADUATES§ | NET GAIN PER $1.00 INVESTED | TOTAL ECONOMIC IMPACT ($) |
| Alabama | 5,542 | 7,892 | 1.4 | $712,872 | $1.20 | $1.4 billion |
| Arkansas | 1,062 | 928 | 0.9 | $1,147,543 | $1.27 | $191 million |
| Florida | 2,842 | 4,837 | 1.7 | $1,215,643 | $1.38 | $906.3 million |
| Georgia | 4,930 | 8,203 | 1.7 | $1,056,760 | $1.58 | $1.6 billion |
| Kentucky Louisiana | 594 | 604 | 1.0 | $1,044,149 | $1.04 | $118.7 million |
| 3,483 | 6,003 | 1.7 | $1,112,454 | $1.42 | $1.1 billion | |
| Mississippi | 3,182 | 3,806 | 1.2 | $958,165 | $1.25 | $695.3 million |
| Missouri North Carolina | 867 | 925 | 1.1 | $1,146,073 | $1.55 | $196.3 million |
| 6,910 | 9,332 | 1.4 | $1,123,827 | $1.36 | $1.8 billion | |
| Oklahoma | 336 | 425 | 1.3 | $1,075,459 | $1.46 | $99.2 million |
| South Carolina | 1,951 | 2,451 | 1.3 | $1,076,279 | $1.18 | $424.4 million |
| Tennessee Texas | 2,861 | 4,226 | 1.5 | $1,111,603 | $1.59 | $992.1 million |
| 4,160 | 8,465 | 2.0 | $896,947 | $1.56 | $1.6 billion | |
| Virginia | 3,774 | 5,362 | 1.4 | $1,129,849 | $1.47 | $1.0 billion |
| West Virginia | 537 | 772 | 1.4 | $1,046,509 | $1.26 | $144.8 million |
| ‡CSG SOUTH AVG | 2,869 | 4,282 | 1.4 | $1,056,942 | $1.37 | $817.9 million |
*Economic impact estimates may vary based on methodology, assumptions, geographic scope, and the metrics used to calculate indirect effects.
While these national and reported totals are certainly impactful and an illustration of the significance of HBCUs to the country’s economic growth, a newer measure may also prove useful for emphasizing the state-level impacts HBCUs have on students, their families, and communities. Nationally, a 2024 report from the UNCF calculated that HBCUs generate more than $16.5 billion in total economic impact per year — with every dollar invested in these institutions returning $1.43 to the regional economy, a net gain of $0.43. Additionally, for each of the more than 136,000 jobs created by HBCUs, an additional 1.5 public and private sector jobs are created off campus as a result of investments on the campus and its students.46 These figures, along with the data in Table 5, illustrate the significant economic and workforce contributions HBCUs make to their communities, regions, and states.
Using millions of anonymized tax records, tuition records, and other state and federal data from 2013 to 2022, a team of researchers at Harvard University has developed several data sets designed to identify barriers to economic opportunity and develop scalable solutions for policymakers to empower individuals in poverty across the U.S. to achieve better lives, income, and economic outcomes. Most notably, this work has focused on access to educational opportunities and workforce training as a means for students from low-income areas to achieve better job and earnings outcomes overall.47
‡ Includes all HBCUs, public and private, in each state.
§ Based on outcomes from the graduating class of 2021, the UNCF report estimates the annual lifetime earnings an HBCU graduate in each state earns compared to others with no post-secondary academic credentials.
** This includes for every direct job created on- or off-campus, the number of additional public or private sector jobs indirectly created for the local economy.
Utilizing data and research from the Opportunity Insights project’s College Mobility Index, the author has been able to distinguish the support HBCUs in the South provide for economic opportunity, success, and mobility when compared to all other colleges and universities — including non-HBCU and private institutions. Specifically, the analysis focuses on the Opportunity Mobility Index (OMI) and compares the average performance of HBCUs in each state with other public and private postsecondary institutions. The OMI refers to the likelihood that a student will end up in an income bracket or tier that is two quintiles, or 20 percent, greater than their family’s income level. This provides one measure of the extent to which these institutions contribute to upward economic mobility.48
TABLE 6. Comparison of Opportunity Mobility Impact of HBCUs to All Public and Private Postsecondary Institutions
| STATE | OMI PERCENT AVERAGE | OMI RANK AVERAGE | TOTAL INSTITUTIONS✝✝ | PERCENTILE |
| Alabama | 26% | 11 | 41 | 27th |
| Arkansas | 33% | 1 | 34 | 3rd |
| Florida | 30% | 5 | 78 | 6th |
| Georgia | 30% | 3 | 69 | 4th |
| Kentucky | 24% | 3 | 24 | 13th |
| Louisiana | 37% | 4 | 26 | 15th |
| Mississippi | 35% | 2 | 28 | 7th |
| Missouri | 24% | 9 | 56 | 16th |
| North Carolina | 32% | 3 | 101 | 3rd |
| Oklahoma | 27% | 5 | 37 | 14th |
| South Carolina | 34% | 1 | 37 | 3rd |
| Tennessee Texas | 31% | 1 | 50 | 2nd |
| 33% | 18 | 123 | 15th | |
| Virginia | 31% | 2 | 62 | 3rd |
| West Virginia | 19% | 7 | 14 | 50th |
| CSG SOUTH AVG. | 30% | 5 | 52 | 10TH |
For the region as a whole, the Opportunity Mobility Index was 0.297, or nearly 30 percent, and public HBCUs typically ranked fifth out of all public and private postsecondary institutions in their states on this economic mobility measure. Opportunity Insights data suggest that students attending HBCUs in the South experience comparatively strong rates of upward economic mobility relative to peer institutions in their states.50 This research from Opportunity Insights highlights the generational economic and income mobility these institutions provide students, highlighting the relationship between HBCUs and workforce and economic mobility outcomes.
✝✝ To better understand the average OMI ranking of HBCUs, this column notes the total number of postsecondary institutions – both private and public, two- and four-year – included in the Opportunity Insights data for each state.
FIGURE 3. Average Opportunity Mobility Index of HBCUs by State in the South
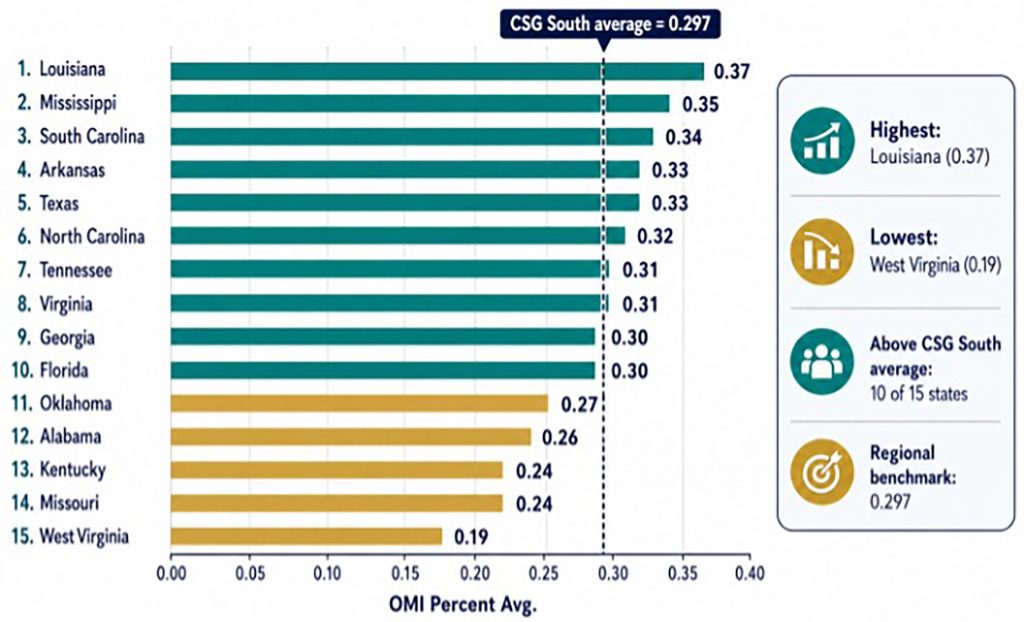
SOURCE: Author’s visualization of calculations using Opportunity Insights data.51
FIGURE 4. Average Opportunity Mobility Index Ranking of HBCUs Out of All Postsecondary Institutions in the State
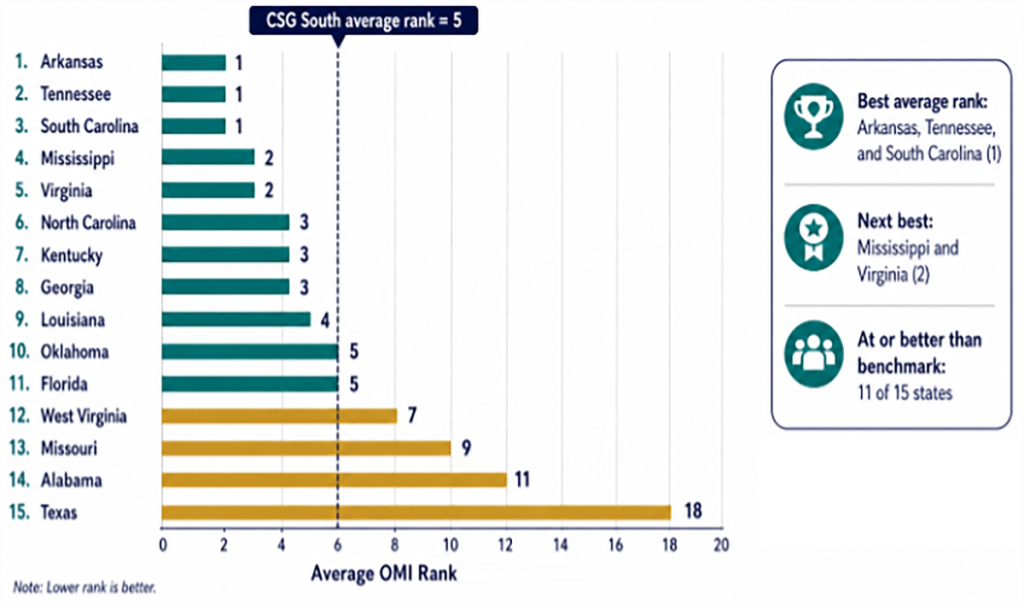
SOURCE: Author’s visualization of calculations using Opportunity Insights data.52
In addition to these metrics, a few other novel initiatives from HBCUs across the South — addressing the healthcare workforce, innovative technologies, or even new academic missions — illustrating the diverse ways these institutions play in supporting economic, social, and workforce development across the region.
ALABAMA
Announced in September 2021, a partnership between the Alabama Office of Apprenticeship (AOA) and one of the state’s HBCUs has created a first-in-the-nation arrangement. Alabama A&M University and the AOA are credited with establishing the first master’s-level apprenticeship program in the country, partnered with an HBCU. In the field of social work, this program serves to fill a critical workforce shortage while also engaging an underrepresented community in the work-based learning space. Students who complete the apprenticeship will earn state board licensure, a Targeted Case Management Certificate from the state Department of Mental Health, and a master’s degree in social work.53 This pilot program represents a promising model for other states in the region seeking to partner higher education and work-based learning — and a collaborative model that may provide benefits for institutions, employers, students, and workforce development efforts.
KENTUCKY
During the 2026 legislative session, lawmakers — recognizing the changing nature of enrollment and economic needs in the state — enacted Senate Bill 185 (2026). Specifically, the state’s only public HBCU — Kentucky State University — will shift to become a polytechnic institution focused on science and technology.54 To address concerns, the legislation requires the university to identify and plan for the “finish-out” of academic programs that will not be retained as part of the institution’s new academic mission, ensuring that current students can still graduate without disruption to their major programs of study. However, the university’s college of education will not be affected, given its importance as part of the institution’s land-grant heritage. Additionally, the measure approved $50 million in bonds to fund the construction of a new health science building to house the HBCU’s nursing program while also retaining the base state funding level for the entire university. In recent years, the university has emphasized increased investment in its nursing and engineering programs, which will allow for even greater alignment as the legislation comes into effect.55
LOUISIANA
The top producer of computer science graduates in the state, Grambling State University — one of Louisiana’s public HBCUs — also established the state’s first cloud computing program.56 Partnering with Amazon Web Services (AWS), the program provides students with the means to not only graduate with a Bachelor of Science in Cloud Computing but also to earn several AWS industry certifications concurrently.57 Careers in this field with these certifications feature a median starting salary of more than $80,000 and include access to high-demand tech positions. Additionally, students have the opportunity to earn industry credentials from Microsoft Azure Solutions, Google Cloud, IBM Cloud, and others.58
SOUTH CAROLINA
In November 2021, a consortium of South Carolina HBCUs partnered with a cyber and information-defense company and the Urban Institute to launch a joint-degree apprenticeship program to fill critical cybersecurity and information technology jobs in the state.59 This innovative apprenticeship program has brought together Urban Institute researchers, HBCU faculty, and South Carolina employers to address the cybersecurity skills shortage in the Palmetto State. The consortium’s apprenticeship program, supported with technical assistance from Urban’s Apprenticeship Modernization and Expansion Fund contract from the U.S. Department of Labor, creates a pathway to high-quality and rewarding careers in cybersecurity and information technology for HBCU students and helps meet employer demand for positions in these fields in the state and nationally.60
WEST VIRGINIA
Recognizing the unique needs of the state’s kinship care population, specifically the many children raised by grandparents or extended family members, West Virginia State University — one of the state’s two public HBCUs — operates the “Healthy Grandfamilies” program. An initiative of the university’s extension service, launched in 2015, the program offers free support, resources, and connections to kinship care provided by grandparents. It also provides hands-on and relevant regional experience to students at the HBCUs’ Department of Social Work to assist them in gaining the expertise necessary to address the preeminent social issues facing families in the Mountain State.61
Through the program, HBCUs’ social work staff and students provide up to 6 months of comprehensive social work services to participants, including intake assessments, connections to community resources, advocacy services, and confidential assistance. Additionally, the Healthy Grandfamilies program provides support and skills training in parenting, communication, healthcare, literacy, legal issues, social media, school services, addiction and recovery, and nutrition.62
Conclusion
FIGURE 5. National Survey of Historically Black Colleges and Universities in the U.S. (2024)
SOURCE: Pew Research Center (2024).63
Like much of the higher education sphere, HBCUs are not immune to growing concerns that demographic changes may lead to future enrollment cliffs that impact funding, outcomes, and operations. While current short-term trends are up, concerns have arisen about the negative effects of enrollment changes on private nonprofit and religious postsecondary institutions. Of the nonprofit postsecondary colleges or universities that have ceased operations since 2020, more than half were religiously affiliated, with more than 30 such institutions also listed as “high risk” by the U.S. Department of Education due to low cash reserves.64 However, in addition to the broader higher education community’s concerns, these historic campuses face a greater threat due to their often lower enrollment rates, religious affiliations, and rural locations. With so many HBCUs — approximately 54 percent — in the region being private and/or religious, and the majority of public and private HBCUs in the region comprising rural-designated institutions, the looming enrollment cliff may raise significant concerns.65
Additional studies by groups such as SHEEO have shown, worryingly, that when institutions close, most students do not transfer and instead give up their pursuit of education entirely. Fewer than half of these students transfer, and of those who do, fewer than half complete their degree programs because they lose credits or have to take out additional loans to pay for courses at the new school. This growing portion of America, more than 40 million and increasing annually, spends time and money to go to college or university, but has no credentials or degree to show for it.66
FIGURE 6. Comparison of Southern State Reenrollment Rates for “Some College, No Credential Students”
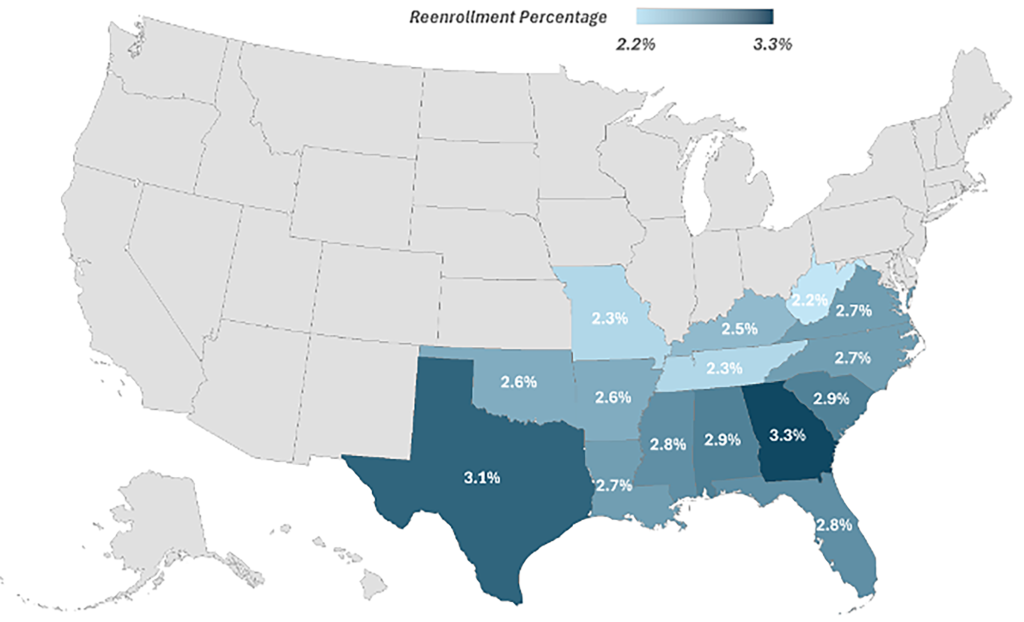
SOURCE: National Student Clearinghouse (2025).67
This is even more important given the numerous studies – including a recent report from The College Board — that show students of color enrolled in HBCUs are 12 percent more likely to graduate and earn a college degree than those enrolled in non-HBCUs. Further, given the increasing focus on STEM (Science, Technology, Engineering, and Math) graduates to meet the ever-growing workforce demands of the South, research also found that HBCU students are more than twice as likely to major in a STEM field and to complete a high-earning degree than non-HBCU enrollees. Building on this, HBCU graduates by age 30 report having household incomes that are more than 10 percent higher than those of non-HBCU graduates from other four-year colleges.68 However, as evidenced above, many public land-grant HBCUs have experienced tremendous growth and success in the South. These differing institutional trends illustrate both the opportunities and challenges facing HBCUs in the South.
Citations
- “White House Initiative to Promote Excellence and Innovation at Historically Black Colleges and Universities,” Presidential Executive Order, The White House, April 23, 2025, https://sites.ed.gov/whhbcu/presidential-executive-order.
- “HBCU Caucus Network,” Black Legislative Leaders Network, 2026, https://www.blln.org/hbcu.
- “Biden Administration Announces Big Investment Totals for HBCUs; $16B in ‘whole of government’ Investments,” United Negro College Fund, May 16, 2024, https://uncf.org/news/biden-administration-announces-big-investment-totals-for-hbcus-16b-in-whole-of-government-investments.
- “Fact Sheet: President Donald J. Trump Promotes Excellence and Innovation at HBCUs,” The White House, April 23, 2025, https://sites.ed.gov/whhbcu/trump-hbcu-fact-sheet.
- “What is an HBCU?” White House Initiative on Historically Black Colleges and Universities, U.S. Department of Education, 2026, https://sites.ed.gov/whhbcu/one-hundred-and-five-historically-black-colleges-and-universities.
- “What is an HBCU?” White House Initiative on Historically Black Colleges and Universities, U.S. Dept. of Edu.
- “Bipartisan Historically Black Colleges and Universities (HBCU) Caucus,” Office of Congresswoman Alma Adams, 12th District of North Carolina, https://adams.house.gov/bipartisan-historically-black-colleges-and-universities-hbcu-caucus.
- “Senator Sonya Halpern Honors Historically Black Colleges and Universities at Georgia State Capitol,” Georgia Senate Press Office, March 17, 2021, https://senatepress.net/senator-sonya-halpern-honors-historically-black-colleges-and-universities-at-georgia-state-capitol.html.
- Burt Jones, Lieutenant Governor, “Op-Ed: Georgia’s HBCUs deserve more funding and attention,” The Atlanta Journal-Constitution, February 28, 2024, https://www.ajc.com/opinion/opinion-georgias-hbcus-deserve-more-funding-and-attention/Z6ANTB2MWVEIVGODSGVDVZ3K3M.
- Georgia Senate Bill 235 (2024), https://www.legis.ga.gov/api/legislation/document/20232024/225559.
- “Op-Ed: Georgia’s HBCUs deserve more funding and attention,” The Atlanta Journal-Constitution.
- Hannah Vinueza McClellan, “State’s new bipartisan HBCU Caucus wants to highlight, expand NC10’s impact,” EdNC, February 8, 2023, https://www.ednc.org/02-08-2023-states-new-bipartisan-hbcu-caucus-wants-to-highlight-expand-nc10s-impact.
- John Buzbee, “Virginia General Assembly forms HBCU caucus,” The Virginian-Pilot, January 23, 2026, https://www.pilotonline.com/2026/01/23/hbcu-caucus-formed.
- Braulis Pimental, “State’s first bipartisan HBCU caucus pushes for increased funding,” WACHFOX57, January 21, 2026, https://wach.com/news/local/states-first-bipartisan-hbcu-caucus-pushes-for-increased-funding.
- “Institutional Data: 2014-2024,” Integrated Postsecondary Education Data System, National Center for Education Statistics, Institute of Education Sciences, U.S. Department of Education, https://nces.ed.gov/ipeds/datacenter/InstitutionList.aspx.
- “State Higher Education Finance Report,” State Higher Education Executive Officers Association, April 9, 2026, https://shef.sheeo.org/report.
- Ibid.
- “Southern University System Overview,” Southern University System, https://www.sus.edu.
- “Education Trust Fund Appropriations,” Executive Budget Office, Alabama Department of Finance, https://budget.alabama.gov/education_trust_fund_appropriations.
- “Financial Statements,” Department of Finance and Administration, University of Arkansas-Pine Bluff, https://uapb.edu/administration/finance-administration/budget-administration.
- “Historical Budget Documents,” Florida Legislature, https://www.flsenate.gov/Session/Bill/2015/5001/BillText/Filed/HTML.
- “Budgeting Reports,” University System of Georgia, https://www.usg.edu/fiscal-affairs/departments/budgeting.
- “Agency Reports – KSU,” Kentucky Legislative Research Commission, https://apps.legislature.ky.gov/AgencyReports/IJC/AR/U/KentuckyStateUniversity.
- “Audit Report,” Louisiana Legislative Auditor, https://lla.la.gov/reports/audit-reports/by-agency.
- “Public Reports,” Legislative Budget Board, Mississippi Legislature, https://www.lbo.ms.gov/PublicReports.
- “Legislative Budgets,” Missouri Department of Higher Education and Workforce Development, https://dhewd.mo.gov/about/legislative-budget.
- “Financial Statement Audit Reports,” The University of North Carolina System, https://www.northcarolina.edu/offices-and-services/finance-and-administration/financial-statement-audit-reports.
- “Fiscal Studies and Reports,” Oklahoma State System of Higher Education, https://okhighered.org/studies-reports/fiscal.
- “Agency Reports,” Digital Collections, South Carolina State Library, https://dc.statelibrary.sc.gov/search.
- “State Audit Reports,” Tennessee Comptroller of the Treasury, https://comptroller.tn.gov/office-functions/state-audit/find-a-report.html.
- “Fiscal Year Budgets,” Legislative Budget Board, Texas Legislature, https://www.lbb.texas.gov/budget.aspx.
- “State Budget Portal,” Legislative Information System, Virginia General Assembly, https://budget.lis.virginia.gov.
- “Fiscal Years,” West Virginia State Budget Office, https://budget.wv.gov/approvedbudget/Pages/default.aspx.
- “Institutional Data: 2014-2024,” Integrated Postsecondary Education Data System, National Center for Education Statistics, Institute of Education Sciences, U.S. Department of Education, https://nces.ed.gov/ipeds/datacenter/InstitutionList.aspx.
- “Financial Disclosures,” Alabama Community College System, https://www.accs.edu/about-accs/financial-disclosure.
- “Publications,” Mississippi Community College Board, https://www.mccb.edu/about/publications.
- Digital Collections, South Carolina State Library.
- IPEDS, U.S. Dept. of Edu.
- Ibid.
- “State Higher Education Finance Report,” SHEEHO.
- IPEDS, U.S. Dept. of Edu.
- “State Higher Education Finance Report,” SHEEHO.
- “History of APLU & Land-Grant Universities,” Association of Public and Land-Grant Universities, https://www.aplu.org/about-us/history-of-aplu.
- “Land-Grant Universities Map,” National Institute of Food and Agriculture, U.S. Department of Agriculture, https://www.nifa.usda.gov/sites/default/files/resource/lgu_map_6_25_2014_0.pdf.
- “Transforming Futures: The Economic Engine of HBCUs (2024 HBCU Economic Impact Report,” United Negro College Fund, https://cdn.uncf.org/wp-content/uploads/FINAL_UNCF_2024-Consumer-HBCUEconomicImpactReport-Digital.pdf.
- Ibid.
- Raj Chetty, et al., Opportunity Insights, Harvard University, https://opportunityinsights.org.
- Raj Chetty, et al., “Mobility Report Cards: The Role of Colleges in Intergenerational Mobility,” Opportunity Insights, Harvard University, https://opportunityinsights.org/data.
- Ibid.
- Ibid.
- Ibid.
- Ibid.
- “First master’s degree registered apprenticeship with an HBCU established in America,” Alabama Political Reporter, September 10, 2021, https://www.alreporter.com/2021/09/10/first-masters-degree-registered-apprenticeship-with-an-hbcu-established-in-the-country.
- Kentucky Senate Bill 185 (2026), https://apps.legislature.ky.gov/record/26rs/sb185.html.
- McKenna Horsley, “What’s next for Kentucky State? Board chair eager to revamp academics, protect students,” Kentucky Lantern, April 15, 2026, https://kentuckylantern.com/2026/04/15/whats-next-for-kentucky-state-board-chair-eager-to-revamp-academics-protect-students.
- “Grambling State University Facts,” University of Louisiana System, https://ulsystem.edu/university-of-louisiana-system/grambling-state-university.
- “Cloud Computing Degree Program,” Grambling State University, https://www.gram.edu/academics/majors/arts-and-sciences/cloud.
- Tisha Arnold, “Grambling’s Cloud Computing Program reaches for sky with industry partners,” GSU Tigers, September 8, 2020, http://web.archive.org/web/20201013235352/https://gsutigers.com/news/2020/9/8/general-gramblings-cloud-computing-program-reaches-for-the-sky-with-industry-partners.aspx.
- “A First-of-its-kind Consortium of South Carolina Historically Black Colleges and Universities (HBCU) Plans to Design and Launch Degree Apprenticeships,” Charleston Regional Business Journal, November 21, 2021, https://crbjbizwire.com/a-first-of-its-kind-consortium-of-south-carolinahistorically-black-colleges-and-universities-hbcu-plans-to-design-and-launch-degree-apprenticeships.
- “ Urban Institute Announces Launch of Innovative Degree-Based Apprenticeship Program in Cybersecurity at South Carolina HBCUs,” Urban Institute, November 19, 2021, https://www.urban.org/press-releases/urban-institute-announces-launch-innovative-degree-based-apprenticeship-program-cybersecurity-south.
- “Healthy Grandfamilies,” Extension Services, West Virginia State University, https://healthygrandfamilies.com.
- Ibid.
- Jenn Hatfield and Monica Anderson, “A look at historically Black colleges and universities in the U.S.,” Pew Research Center, October 2, 2024, https://www.pewresearch.org/short-reads/2024/10/02/a-look-at-historically-black-colleges-and-universities-in-the-u-s.
- Jon Marcus, “Losing faith: Rural, religious campuses are among the most endangered,” Hechinger Report, May 18, 2025, https://hechingerreport.org/losing-faith-rural-religious-campuses-are-among-the-most-endangered.
- “What is an HBCU?” White House Initiative on Historically Black Colleges and Universities, U.S. Dept. of Edu.
- Jon Marcus, “Colleges are now closing at a pace of one a week. What happens to the students?,” Hechinger Report, April 26, 2024, https://hechingerreport.org/colleges-are-now-closing-at-a-pace-of-one-a-week-what-happens-to-the-students.
- “Some College, No Credential Student Outcomes,” 2025 Report for the Nation and the States, National Student Clearinghouse Research Center, https://nscresearchcenter.org/some-college-no-credential-dashboard.
- “HBCU Enrollment Drives Positive Longer-Term Student Outcomes,” College Board Research, June 14, 2024, https://allaccess.collegeboard.org/hbcu-enrollment-drives-positive-longer-term-student-outcomes.