
Issue Brief by Senior Policy Analyst, Tom Opdyke | topdyke@csg.org
Electricity prices for consumers increased across the country by 5.2 percent between June 2024 and June 2025,¹ leading policymakers to consider what can be done to minimize electricity utility rate increases or, at the very least, prevent them from continuing to rise. However, as policymakers know, there are a multitude of factors influencing electricity pricing; therefore, it is necessary to unpack these factors and consider how each affects pricing.
For example, each Southern state has a unique combination of production methods, including coal, natural gas, nuclear, and others, that make up its energy profile, and what might be cost-effective in Missouri may not be the case for Mississippi. In addition, how electricity is sold and transmitted varies across the region. In Texas, residents can choose their utility provider (the company to which they pay for electricity), whereas this is generally not the case in Alabama. Beyond this, some Southern states lie within Regional Transmission Organizations (RTOs) or Independent System Operators (ISOs), while others do not, creating different structures for how energy is transmitted and purchased to power each state’s grid. Each of these has the potential to affect the final price on a consumer’s power bill.
This Issue Brief will discuss each of these factors and, as demand for electricity increases, explore the costs states may incur to build more energy production facilities in the next 25 years.
Near-Term Solutions
Beyond considering larger, long-term strategies, some approaches may be quicker to deploy, such as lowering utility costs or, at least, freeing up more of a state’s baseload for consumer use. For example, Advanced Transmission Technologies (ATTs) offer policymakers a near-term solution to improve the efficiency of power lines, thus unlocking additional capacity from the existing grid.² Policymakers could also consider programs that encourage Demand-side Management (DSM), which enable consumers to modify their level and pattern of electricity usage. Many electric utilities already use DSM to enhance customer service.³ These programs help reduce costs for consumers and electricity providers because, due to lower consumer demand, companies can avoid spending on increased infrastructure (e.g. new power sources, more transmission lines, etc.).⁴
Costs and Production
As mentioned in the introduction, electricity costs for consumers went up 5.2 percent between June 2024 and June 2025.⁵ As shown in Table 1, overall costs for all sectors (residential, commercial, industrial, and transportation) in Southern states remained below the national average, but the percentage increase from June 2024 to June 2025 in six states rose faster than the national average.
TABLE 1. Average Price of Electricity to Ultimate Customers by End-Use Sector
| State | Residential | Residential | Commercial | Commercial | Industrial | Industrial | All Sectors | All Sectors | Percentage Increase |
|---|---|---|---|---|---|---|---|---|---|
| State | June 2025 | June 2024 | June 2025 | June 2024 | June 2025 | June 2024 | June 2025 | June 2024 | 2024–2025 |
| Alabama | $16.00 | $15.06 | $14.44 | $13.65 | $8.15 | $7.60 | $12.79 | $12.17 | 5.1% |
| Arkansas | $13.33 | $12.38 | $10.84 | $10.03 | $6.83 | $6.52 | $10.05 | $9.59 | 4.8% |
| Florida | $15.36 | $13.87 | $11.48 | $10.66 | $8.85 | $8.33 | $13.49 | $12.33 | 9.4% |
| Georgia | $16.00 | $15.56 | $12.37 | $11.66 | $9.22 | $8.70 | $13.26 | $12.81 | 3.5% |
| Kentucky | $13.62 | $13.04 | $11.88 | $11.74 | $7.06 | $6.45 | $10.74 | $10.27 | 4.6% |
| Louisiana | $12.64 | $11.45 | $11.15 | $9.85 | $6.34 | $5.36 | $9.62 | $8.60 | 11.9% |
| Mississippi | $13.94 | $13.23 | $12.85 | $12.13 | $7.47 | $6.79 | $11.62 | $10.99 | 5.7% |
| Missouri | $15.84 | $14.49 | $12.42 | $11.70 | $9.65 | $8.81 | $13.55 | $12.59 | 7.6% |
| North Carolina | $13.33 | $13.43 | $9.76 | $10.22 | $7.67 | $7.61 | $11.06 | $11.24 | 1.6% |
| Oklahoma | $13.62 | $12.20 | $9.77 | $9.55 | $6.49 | $6.12 | $10.14 | $9.57 | 6.0% |
| South Carolina | $14.71 | $13.82 | $11.00 | $10.58 | $7.21 | $6.98 | $11.48 | $10.96 | 4.7% |
| Tennessee | $13.98 | $12.48 | $13.49 | $12.12 | $6.75 | $6.09 | $12.08 | $10.92 | 10.6% |
| Texas | $15.23 | $14.56 | $8.60 | $9.03 | $6.34 | $6.46 | $10.24 | $10.31 | -0.7% |
| Virginia | $15.41 | $15.25 | $9.66 | $9.23 | $9.10 | $8.86 | $11.52 | $11.23 | 2.6% |
| West Virginia | $15.82 | $15.48 | $11.49 | $11.59 | $8.35 | $7.85 | $11.42 | $11.11 | 2.8% |
| U.S. Total | $17.47 | $16.39 | $13.63 | $13.01 | $8.86 | $8.43 | $13.88 | $13.20 | 5.2% |
Compare this to Figure 1, which shows each Southern state’s sources for power generation. These data show that there is no clear parallel between energy sourcing (including natural gas used to produce electricity) and electricity costs. For example, comparing Oklahoma and Arkansas — the states with the two lowest rates — shows two very different energy profiles. Oklahoma relies on 6.5 percent from coal, 50.6 percent from natural gas, more than 40 percent from renewables (mainly wind), and no reliance on nuclear. Alternatively, Arkansas generates 26.3 percent from coal, 38.3 percent from natural gas, 24.8 percent from nuclear, and 5.1 percent from renewables.
However, Oklahoma and Arkansas’ utility rates differ by nearly 70 cents. A closer comparison lies between West Virginia and North Carolina; the difference in average utility costs between the two states is only two cents. In West Virginia, the bulk of the state’s power comes from coal (84.7 percent), along with natural gas (7.6 percent) and renewables (4.3 percent). North Carolina, however, generates its power from a broader range of sources: 12.6 percent from coal, 41.3 percent from natural gas, 32.0 percent from nuclear, and 10.7 percent from renewables.
As the data seen in Table 1 and the energy profiles seen in Figure 1 illustrate, there is no clear correlation between a particular energy source and the rate charged to the end user.
FIGURE 1. Southern State Energy Profiles
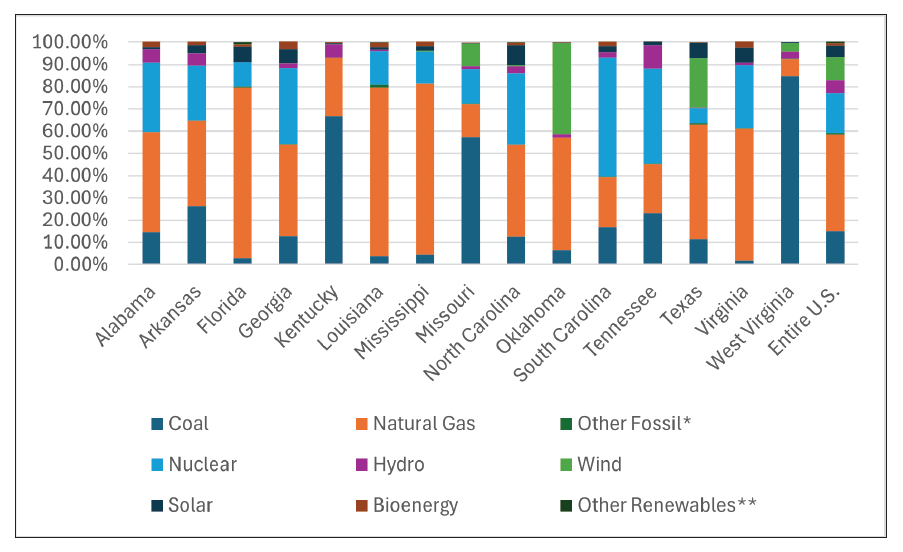
*“Other fossil” includes additional oil & petroleum products, as well as manufactured gases and waste
** “Other renewables” includes geothermal, tidal, and wave generation
Local Resources
Each state has a unique makeup of resources that are used for energy production. Oklahoma’s high winds in the western part of the state, in areas such as Guymon and Weatherford, make it well-suited for wind power.⁸ Alternatively, Kentucky’s coal (which accounts for 66.9 percent of the state’s energy profile)⁹ is more abundant than that of most other states.¹⁰
Taking a closer look at coal, West Virginia relies on it more than any other Southern state. This is largely because coal is abundant in the Mountain State, so transportation and production are cheaper than in Mississippi, for instance. This means West Virginia can use its natural resources to help keep down consumer utility costs. In addition, West Virginia has a low population density, meaning a lower strain on its power grid, which in turn means fewer maintenance and infrastructure costs for utilities.¹¹
Considering natural gas, three-quarters of Louisiana’s grid is powered by natural gas used to generate electricity, and the Pelican State has the cheapest utility costs for all sectors among Southern states. As shown in Figure 2, Louisiana is also one of the top five states for natural gas production.¹³ Florida, however, also powers more than three-quarters of its grid with natural gas, yet its utility rates are the second highest among Southern states. This is, in part, because Florida generates less than 1 percent of Louisiana’s natural gas production.¹⁴ Instead, Florida imports most of its natural gas from neighboring states like Alabama and Georgia.¹⁵
FIGURE 2. U.S. Dry Natural Gas Production by State (2022)
Units are in billion cubic feet.
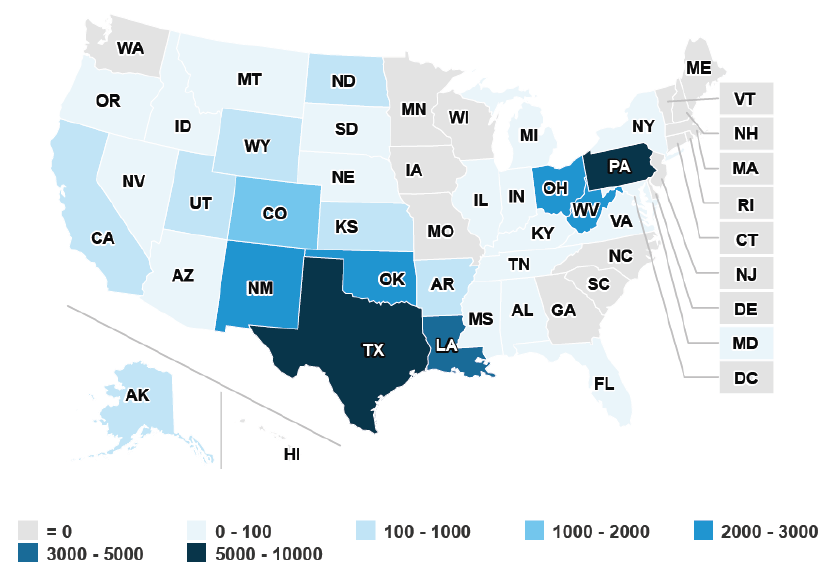
FIGURE 3. Average Annual Wind Speed in the U.S.
Average Annual Wind Speed at 80 Meters
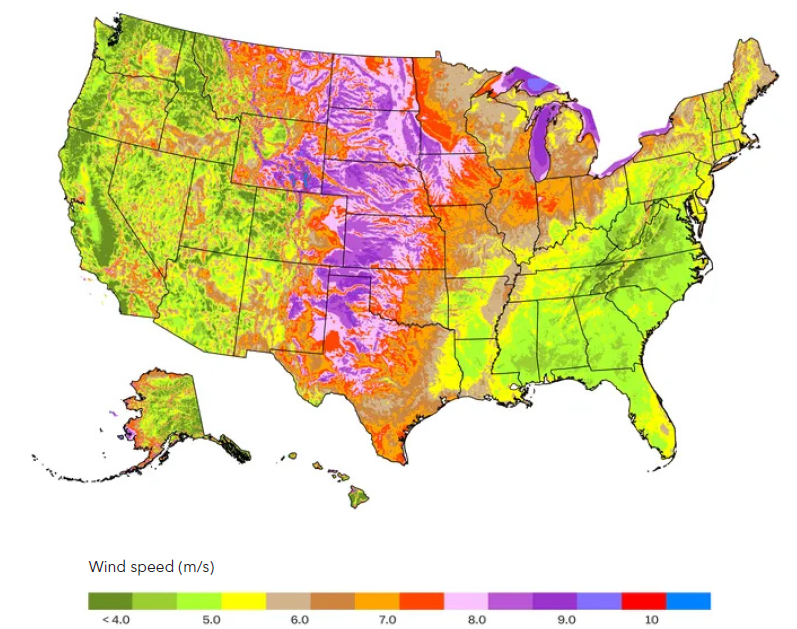
Similarly, while certain Southern states have a higher percentage of wind power in their energy profiles, some of these are simply better suited for wind power, which, unlike natural gas, is not a resource that can be exported to other states. Oklahoma, for example, generates more than 40 percent of its energy from onshore wind. Texas’s onshore wind generation accounts for 22 percent of its energy profile, though when comparing output in megawatts (MW), Texas outproduces Oklahoma by more than threefold.¹⁷ As shown in Figure 3, Oklahoma and Texas are better suited to harness the natural resource of high-speed winds, which is not as abundant in states like Alabama or South Carolina.
As a result of these differences, Southern states have often built their respective grids mainly based on which resources are cheaply available locally. Therefore, not every state may seek to build a grid that relies as much on wind as Oklahoma or on coal as much as West Virginia. As a result, there is no one-size-fits-all solution to energy production that ensures the cheapest electric utility rates.
Regulated vs. Unregulated Energy Markets
State governments have different approaches to control how companies can sell electricity to consumers. This is often discussed in terms of regulated vs. unregulated energy markets. In regulated energy markets, utilities are usually vertically integrated, which means a utility manages the entire energy supply chain from generation to transmission to distribution. In this system, a single utility is given a monopoly over a designated area. This could be a region within the state or the entirety of the state.¹⁸ In this system, consumers cannot choose which utility from which they buy electricity. Most states across the country have regulated energy markets, including 13 out of the 15 Southern states (Texas and Virginia being the exceptions).¹⁹
In states with regulated energy markets, Public Utility Commissions (PUCs), also known as Public Service Commissions (PSCs) in some states, act as regulators and approve the rates utilities can charge consumers.²⁰ For example, in Georgia, the state’s PSC recently announced that it had made an agreement with the state’s main electricity provider, Georgia Power, to freeze consumer base rates (i.e. the cost of electricity before surcharges) for three years.²¹
Public Utility Commissions
Public Utility Commissions (PUCs), also known as Public Service Commissions (PSCs) in some states, are regulatory agencies that oversee utility companies and, in some cases, set utility rates. This differs from the Federal Energy Regulatory Commission (FERC), which oversees transactions between states.²² It is important to note that PUCs and PSCs may not have authority over all utilities; exceptions tend to include cooperatives and municipal utilities.²³
Eighteen states, along with Washington D.C., have unregulated markets, including Texas and Virginia. In an unregulated energy market, consumers are not restricted to a single company when choosing their utility providers. In addition, the company consumers pay for electricity may not always be the same company that generated that electricity. In other words, Company A may produce electricity, but Company B may be the retail provider that a consumer pays for that electricity. This system originated in the 1990s, when the Federal Energy Regulatory Commission (FERC) permitted electric utilities to sell their generating assets, resulting in the creation of independent energy suppliers that owned generators.²⁴ Advocates of this system argue that competition among utility retailers is likely to create lower prices, better customer service, and more diverse options for consumer payment plans (e.g. fixed rate plans, variable rate plans, etc.).²⁵ While PUCs in states with deregulated markets still oversee retailers,²⁶ some argue that consumers do not benefit in deregulated markets. For example, University of Houston professor Ed Hirs argues that states with deregulated markets, such as California and Texas, end up costing consumers more in the long term since utilities there focus more on profits than investing in infrastructure.²⁷
Retail Electricity Choice
One caveat to regulated vs. deregulated markets is states with retail electricity choice. Customers who live in states with regulated markets, but with retail electricity choice, can purchase electricity from retail suppliers other than their local utility.²⁸ In the South, this essentially only applies to Georgia, which offers this option, but only to large commercial and industrial consumers with loads of 900KW or more (roughly the usage of a large grocery store each year).²⁹
Comparing Costs
From 2012 to 2021, residential rates in deregulated states increased more than in regulated states. In deregulated states, costs increased by 2.5 percent over ten years, compared to 1.4 percent in regulated states. In 2021 specifically, average rates in deregulated states increased by 6.7 percent, compared to a 5.3 percent increase in regulated states.³⁰
Since deregulation began in the 1990s, residents living in a deregulated market have, on average, paid $40 per month more for electricity than those in regulated states.³¹ Academic researchers from Harvard University and the University of Florida have proposed that the reason behind this difference is that, after deregulation, prices were no longer tied to price caps for downstream consumers (e.g. those set by a PUC) and, instead, generators charged utilities more for their contracts.³²
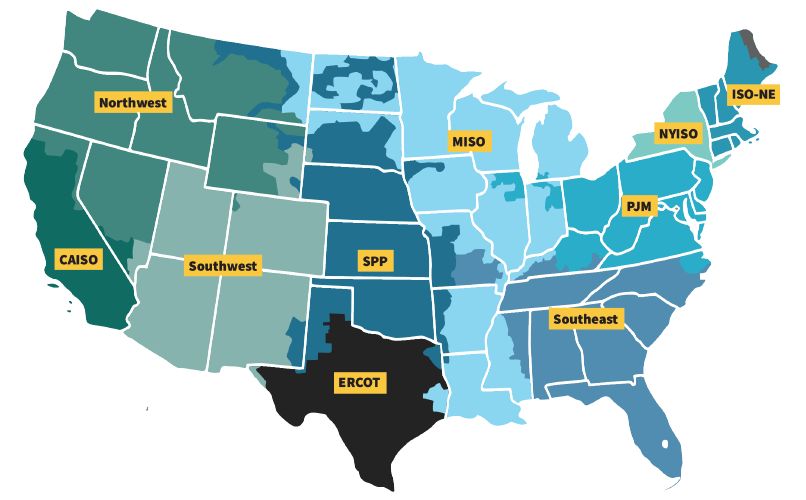
Regional Transmission Organizations and Independent System Operators
In 1997, FERC issued new rules allowing electric utilities to decouple their operations by separating generation, transmission, and distribution. These rules also created a new system of transmission operators called Regional Transmission Organizations (RTOs) and Independent System Operators (ISOs). Under FERC’s orders, these are nonprofits meant to operate the transmission systems of public utilities and administer wholesale energy markets in their service territories, independent of business interests related to the real sale or purchase of electric power.³³
RTOs generally differ from ISOs in that they serve more than one state (though a few ISOs may operate in more than one state), and RTOs have a slightly larger role in maintaining the transmission network. In addition, an ISO may actually be an RTO in all but name (in that the ISO may not have applied for RTO status from FERC).³⁴ It is important to note that, with one exception – the Electric Reliability Council of Texas (ERCOT) – all RTOs and ISOs fall under FERC’s purview, meaning that ERCOT is the only ISO in the country that operates outside the rules of federal regulations.³⁵
RTOs and ISOs oversee the flow and sale of electricity within their regions (shown in Figure 4). Meaning that an electric utility in St. Louis, which is within the Midcontinent Independent System Operator (MISO) RTO, is purchasing its power in the same market (and under similar conditions) as a utility in New Orleans or Green Bay, Wisconsin. Currently, two-thirds of the nation’s electricity load is served by one of the seven RTOs or ISOs throughout the country.³⁶
FIGURE 4. A Map of RTOs and ISOs in the U.S.
Energy Markets
Energy Markets differ depending on whether the utility is in a regulated or unregulated state and whether it is within an RTO or ISO (which may depend on where the utility is operating in a state). Within an RTO or ISO system, regardless of whether it occurs in a regulated or deregulated state, power generators (e.g. a company owning electricity-producing facilities) sell to utilities (those supplying electricity to consumers) via wholesale markets. Generally, there are three types of markets: day-ahead, real-time, and capacity.³⁸
In areas without an ISO or RTO, utilities must perform all the functions of an ISO or RTO. Broadly speaking, these are the Northwest, Southwest, and Southeast. These are generally considered “traditional wholesale electricity markets” or “bilateral electricity markets.” The electric utilities in these markets are frequently vertically integrated, so they own the generation, transmission, and distribution systems. Wholesale market trades typically occur through bilateral transactions.³⁹
For example, since the Southeast (which FERC defines as all or parts of Florida, Georgia, Alabama, Mississippi, North Carolina, South Carolina, Missouri, and Tennessee) mainly consists of regulated markets not under an RTO or ISO, the bulk of electricity sales are done bilaterally between utilities (sometimes in neighboring states).⁴⁰ The majority of these sales happen on a long-term basis (i.e. a year or more). Short-term transactions normally account for less than 1 percent of transactions and tend to occur during periods of system stress (e.g. heat waves or cold snaps).⁴¹ One researcher from Duke University noted that, were the Southeast to adopt an RTO model, this would “likely offer a more transparent transmission interconnection process compared with that of a vertically integrated utility.”⁴²
Day-ahead Markets
Utilities, using forecasts, buy the electricity they predict will be needed the following day. Power generators then commit to producing the electricity sold for the following day. The vast majority of electricity sales within an RTO or ISO, approximately 95 percent, occur in this type of market.⁴³Real-time Markets
Electricity sales between producers and utilities, facilitated by an RTO or ISO, are delivered for near immediate use (usually between 5 and 15 minutes) in the event of increased demand. These types of sales are generally 5 percent or less of overall electricity sales. With the addition of more power-generating sources that have variable production rates (e.g. wind and solar), real-time markets help balance the demand for electricity with what is available in the moment.⁴⁴Capacity Markets
Within some RTOs and ISOs (including MISO and PJM), this type of market considers future demand, and producers place competitive bids to be available for generation in the future. This means that, instead of paying producers upon the sale of electricity, producers are paid for their ability to generate power, should it be required.⁴⁵

Energy demand across the U.S. is expected
to grow by 50 percent by 2050.
Increased Energy Production
As discussed in the “Costs and Production” section, based on data showing states’ energy production methods and utility prices, there is no clear factor in decreasing electricity rates. In addition, as shown in Figure 5, power generation costs account for the highest percentage of electricity pricing across the country.
However, as states grapple with increased demand for energy, bringing more generation facilities online is still imperative. Energy demand across the U.S. is expected to grow by 50 percent by 2050.⁴⁶ With this in mind, Table 2 shows the expected energy production needs of each Southern state by 2050.
FIGURE 5. Major Components of the U.S. Average Price of Electricity (2022)
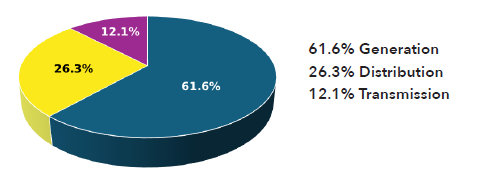
SOURCE: EIA.⁴
Therefore, states must consider what production methods can be brought online at the lowest cost for their residents. Table 3 contains data that shows the costs for 17 energy production methods if the technology were built today and maintained and operated at the same rate for twenty-five years.
TABLE 2. Expected Energy Needs of Southern States by 2050
| State | 2024 (thousand MWhs) | Est. 2050 (thousand MWhs) |
|---|---|---|
| Alabama | 143,219 | 214,829 |
| Arkansas | 59,641 | 89,462 |
| Florida | 265,406 | 398,109 |
| Georgia | 140,481 | 210,722 |
| Kentucky | 67,029 | 100,544 |
| Louisiana | 99,006 | 148,509 |
| Mississippi | 74,371 | 111,557 |
| Missouri | 67,921 | 101,882 |
| North Carolina | 135,600 | 203,400 |
| Oklahoma | 94,998 | 142,497 |
| South Carolina | 100,380 | 150,570 |
| Tennessee | 75,426 | 113,139 |
| Texas | 563,753 | 845,630 |
| Virginia | 101,922 | 152,883 |
| West Virginia | 50,845 | 76,268 |
| Entire U.S. | 4,304,039 | 6,456,059 |
TABLE 3. Projected Costs of Energy Production Methods Over a 25-Year Period
| Technology | Description | Capacity (MW) | Capital Cost | 25-Year Cost | Cost per MW |
|---|---|---|---|---|---|
| Natural Gas Combustion Turbine (Simple Cycle, H Class)*** | 1 x H Class | 419 | $350,088,000 | $377,874,805 | $901,849 |
| Natural Gas Combustion Turbine (Combined-cycle1x1x1, Single Shaft) | 1 x 1 H Class SS | 627 | $577,409,000 | $725,299,075 | $1,156,777 |
| Natural Gas Combustion urn Turbine (Combined-cycle, 2x2x1) | 2 x 1 H Class | 1227 | $1,064,548,000 | $1,566,004,704 | $1,276,287 |
| Solar PV (Single-Axis) | 150 MW (AC) | 150 | $225,348,000 | $232,934,250 | $1,552,895 |
| Onshore Wind – Large Plant Footprint**** | 200 MW | 2.8 MW WTG | 200 | $297,752,000 | $314,282,000 | $1,571,410 |
| Natural Gas Combustion Turbine (Simple Cycle, Aeroderivative Turbines x 4) | 4 x 54 MW Gross | 211 | $338,953,000 | $389,259,082 | $1,844,830 |
| Solar PV (Single-Axis) and AC-Coupled Battery Storage | 150 MW (AC) Solar 50 MW | 200 MWh Storage | 150 | $326,297,000 | $340,693,250 | $2,271,288 |
| Solar PV (Single-Axis) and AC-Coupled Battery Storage | 150 MW (AC) Solar 50 MW | 200 MWh Storage | 150 | $384,081,000 | $398,796,000 | $2,658,640 |
| Natural Gas Combustion Turbine (Combined-cycle, 1x1x1, Single Shaft) with 95% Carbon Capture | 1 x 1 H Class SS | 543 | $1,284,445,000 | $1,517,472,579 | $2,794,609 |
| Fixed-bottom Offshore Wind | 900 MW | 15 MW WTG | 900 | $3,319,969,000 | $3,666,469,000 | $4,073,854 |
| Coal Plant without Carbon Capture | 1 x 735 MW Gross | 650 | $2,666,719,000 | $3,166,819,000 | $4,872,029 |
| Hydroelectric Power Plant | New Stream Reach Development | 100 | $707,254,000 | $715,639,000 | $7,156,390 |
| Conventional Nuclear (Brownfield)* | 2 x AP1000 | 2156 | $16,948,167,000 | $18,873,685,000 | $8,754,028 |
| Coal with 95% Carbon Capture | 1 x 819 MW Gross | 650 | $4,774,917,000 | $5,773,929,500 | $8,882,968 |
| Biomass Plant with 95% Carbon Capture | 1 x BFB | 50 | $631,553,000 | $745,887,750 | $14,917,755 |
| Geothermal | Binary Cycle | 50 | $198,147,000 | $4,455,216,160 | $89,104,323 |
*25-Year Cost includes operational costs with calculations based on the average net load for similar production facilities across the country, as well as adjusting the initial December 2023 dollar figures to July 2025 inflation (5%)
†Based on a cost of $658.63 million for equipment, material, and construction of each SMR; as there are currently no commercially available SMRs, actual costs may be more per unit
††25-Year Cost includes one $23,100 start per year
‡ Based on Great Plains Wind Farms
‡ ‡ Based on Plant Vogtle Reactors 3 & 4; future conventional nuclear reactors may not have the same cost overruns
The data in Table 3 are based on surveys and calculations from the U.S. Energy Information Agency (EIA). Some of these calculations are based on recent examples of energy facility construction, such as the conventional nuclear category, which is based on Plant Vogtle reactors 3 and 4 in Georgia.
It is important to note that the information in Table 3 is not a definite window into the future; many factors could change these projections between today and 2050. For example, the federal government recently lifted a ban on importing liquefied natural gas. This may lead to increased natural gas costs, as companies export natural gas to markets that offer higher prices.⁴⁷ A 2024 Department of Energy study found that a large uptick in exports could increase household electricity costs by 3.5 percent.⁴⁸ Therefore, the natural gas turbines may not be one of the cheaper methods of electricity production in the near future.
However, these data do provide the basis for estimating the costs of energy facilities that will likely be needed to meet the demands of the next 25 years. If states were to keep their current energy profiles (as shown in Figure 1), they could use the data in Table 3 to estimate the costs of scaling up energy production. For example, Alabama’s current energy profile consists mainly of natural gas, nuclear, and coal. If it were to maintain this profile, the Yellow Hammer state may require nearly $73 billion to build new energy facilities in the next 25 years. West Virginia, in turn, may only need $31 billion, while Texas would need approximately $205 billion.⁶,⁴⁴,⁴⁵,⁴⁶
In order to keep costs down and minimize the costs passed on to residents through utility bills and taxes, Southern states could also consider shifting aspects of their energy profiles to embrace cheaper energy production options for future expansion. For example, utility-scale solar may cost less than wind, coal, hydropower, or geothermal options.
Three natural gas production methods may cost less than solar; however, as discussed previously (see “Local Resources” section), this would likely be more cost-efficient for a state like Louisiana with abundant natural gas resources than Florida’s current natural gas production. Though, as mentioned previously, natural gas prices may go up if companies export their product to international markets offering higher prices.
The same goes for wind power. The data in Table 3 are based on wind generation potential in Great Plains states. However, as Figure 2 in the “Local Resources” section shows this potential may be more useful for states like Oklahoma, Missouri, and Texas, but less so for Alabama, for example.
Conclusion
There are numerous factors that influence electric utility rates. Policymakers seeking to reduce electricity prices for consumers have several potential strategies to consider, each with nuanced implications and trade-offs. For instance, transitioning to a deregulated market may provide residents with greater choice among retail electricity providers; however, evidence suggests that such a shift can, over time, lead to higher overall costs for consumers. Similarly, in states operating within a Regional Transmission Organization (RTO) or an Independent System Operator (ISO) infrastructure, discussions may arise regarding the establishment of capacity markets, which alter how power generators sell electricity to utilities. Yet, this approach often requires careful adjustment to account for the growing share of renewable energy resources.
Most importantly, policymakers will need to determine which electricity generation sectors to invest in over the next 25 years. How electricity is generated is the most significant factor in consumer pricing, so finding the best balance between grid reliability and consumer affordability is crucial. New nuclear technologies may offer the most cost-effective solution, but the small modular reactor industry is still new and unproven. Natural gas, in turn, may also appear enticing in 2025, but larger factors like increased liquid natural gas exports may drive up the cost over the next 25 years. No one can see exactly what the future holds, but a sound understanding of the factors that affect electricity pricing is essential as state leaders consider new policies.
End Notes
- “Electric Power Monthly,” U.S. Energy Information Administration, accessed August 12, 2025.
- Yaron Miller, “Advanced Transmission Technologies Can Help States Meet Growing Energy Demand,” The Pew Charitable Trusts, January 2025.
- “Electric Utility Demand Side Management,” U.S. Energy Information Administration, accessed August 14, 2025.
- “Demand-side Management Programs Save Energy and Reduce Peak Demand,” U.S. Energy Information Administration, March 29, 2019.
- “Electric Power Monthly,” U.S. Energy Information Administration, accessed August 12, 2025.
- Ibid.
- “Net Generation for All Sectors, Annual,” U.S. Energy Information Administration, accessed August 4, 2025.
- Umair Irfan and Javier Zarracina, “4 Maps That Show Who’s Being Left Behind in America’s Wind-Power Boom,” Vox, June 14, 2019.
- “Net Generation for All Sectors, Annual,” U.S. Energy Information Administration, accessed August 4, 2025.
- “Coal Explained,” U.S. Energy Information Administration, accessed October 30, 2025.
- Sana Ijaz, “20 States That Have The Cheapest Electricity In The US,” Yahoo! Finance, October 23, 2023.
- “Natural Gas Explained,” U.S. Energy Information Administration, September 2023.
- Natural Gas Gross Withdrawals and Production, U.S. Energy Information Administration, accessed August 5, 2025.
- Ibid.
- International & Interstate Movements of Natural Gas by State, U.S. Energy Information Administration, accessed August 5, 2025.
- Umair Irfan and Javier Zarracina, “4 Maps That Show Who’s Being Left Behind in America’s Wind-Power Boom,” Vox, June 14, 2019.
- Ryan Wiser et al, “Land-Based Wind Market Report,” Lawrence Berkeley National Laboratory, August 2024.
- “Regulated Energy Markets,” Compared Power, accessed August 6, 2025.
- “Public Utility Commissions,” Compared Power, accessed August 6, 2025.
- Ibid.
- “List of Covered Electric Utilities’ under the Public Utility Regulatory Policies Act of 1978 (PURPA),” U.S. Department of Energy, October 2006.
- “Compared Power,” accessed August 6, 2025.
- “Commissioners Approve Three-Year Rate Freeze for Georgia Power,” Georgia Public Service Commission, July 1, 2025.
- Kathryne Cleary and Karen Palmer, “US Electricity Markets 101,” Resources for the Future, March 17, 2022.
- “Deregulated Energy Markets,” Compared Power, accessed August 6, 2025.
- “How Utilities Determine Generation and Distribution Rates,” Electric Choice, accessed August 6, 2025.
- Ed Hirs, “No Shining Example: Texas-Style Electric Deregulation Is Bad for Consumers,” Utility Drive, December 8, 2023.
- “Power Market Structure,” U.S. Environmental Protection Agency, accessed August 11, 2025.
- “An Introduction to Retail Electricity Choice in the United States,” U.S. National Renewable Energy Laboratory, accessed August 11, 2025; Kenna Simmons, “The Power to Choose,” Georgia Trend, August 1, 2018.
- “Retail Electric Rates in Regulated and Deregulated States, 2021 Update,” American Public Power Association, May 2022.
- Ivan Penn, “Why Are Energy Prices So High? Some Experts Blame Deregulation,” The New York Times, January 4, 2023.
- Alexander MacKay and Ignacia Mercadal, “Do Markets Reduce Prices? Evidence from the U.S. Electricity Sector,” Harvard Business School, March 30, 2024.
- “Order 888-A,” Federal Energy Regulatory Commission, March 4, 1997.
- Kit White, “Energy Markets 101: Regional Transmission Organizations, Independent System Operators and Energy Efficiency,” Midwest Energy Efficiency Alliance, September 9, 2024.
- “Electric Power Markets,” Federal Energy Regulatory Commission, accessed August 7, 2025.
- Ibid.
- White, 2024.
- “ERCOT,” Federal Energy Regulatory Commission, accessed October 30, 2025.
- “Energy Imbalance Markets,” U.S. National Renewable Energy Laboratory, accessed August 15, 2025.
- Ibid.
- “An Introductory Guide to Electricity Markets Regulated by the Federal Energy Regulatory Commission,” U.S. Federal Energy Regulatory Commission, accessed August 15, 2025.
- “Electric Power Markets,” Federal Energy Regulatory Commission, accessed August 7, 2025.
- Jennifer Chen, “Evaluating Options for Enhancing Wholesale Competition and Implications for the Southeastern United States,” Duke University, March 2020.
- “Energy Primer: A Handbook of Energy Market Basics,” U.S. Federal Energy Regulatory Commission, November 2015.
- Chen, 2020.
- “Electricity Explained: Factors Affecting Electricity Prices,” U.S. Energy Information Administration, accessed August 14, 2025.
- Robert Walton, “US Electricity Demand Will Grow 50% by 2050, Electrical Manufacturer Study Finds,” Utility Drive, April 7, 2025; “EIA Projects Nearly 50% Increase in World Energy Use By 2050, Led By Growth In Renewables,” U.S. Energy Information Administration, October 7, 2021.
- “Electricity Data Browser,” U.S. Energy Information Administration, accessed August 15, 2025.
- “Capital Cost and Performance Characteristics for Utility-Scale Electric Power Generating Technologies,” U.S. Energy Information Administration, January 2024; “U.S. Energy Atlas,” U.S. Energy Information Administration, accessed August 17, 2024.
- “Directory of Power Plants in the United States,” Grid Info, accessed August 15, 2025.
- Mike Soraghan, “Trump’s Push For More LNG Exports Risks Domestic Price Surge,” Politico, April 14, 2025.
- “Energy, Economic, and Environmental Assessment of U.S. LNG Exports,” U.S. Department of Energy, December 2024.
- Danielle Powers and Mark Karl, “The End of an Era: Why Capacity Markets No Longer Fit the Grid,” Concentric Energy Advisors, March 24, 2025.