Issue Brief by Policy Analyst, Erin Twomey Partin | etpartin@csg.org
DOWNLOADExecutive Summary
While the federal government provides foundational support for veterans through the United States Department of Veterans Affairs (VA), states play a vital role in ensuring veterans’ economic, social, and healthcare needs are met. State-level policies influence how veterans access benefits, fill service gaps, and structure initiatives to meet the specific needs of local veteran populations.
In addition to supporting veterans currently residing in their state, policymakers are exploring ways to attract and retain veterans to their workforce. Doing so may allow local economies to harness veterans’ unique skill sets. Several states have even broadened their efforts by targeting veteran spousal support in areas such as licensure transfer and education.
The purpose of this issue brief is to highlight policies emerging across the CSG South region that are designed to support resident veterans and attract those from out of state. Policies and programs from five CSG South member states, Alabama, Florida, Georgia, Missouri, and Texas, are reviewed and analyzed to determine how they meet veterans’ needs. These five states were specifically chosen to highlight potential policy paths, including benefit accessibility, workforce development, mental health, justice involvement, tax policy, and education, while also showcasing how a state may adapt these policies to address broader economic and
social demands.
Introduction
State-level veteran affairs departments are key actors in ensuring veterans receive the benefits and support they have earned. While the U.S. Department of Veterans Affairs administers federal benefits, housing programs and national cemeteries, state agencies supplement these efforts by helping veterans access federal benefits and by offering additional services. States tend to focus their efforts on assisting veterans in navigating benefits, workforce development, mental health, justice involvement, tax relief, and education.
Understanding our Veteran Population
Location
A large share of the veteran population lives in the South. In 2025, Texas and Florida had the two largest veteran populations, with 1,518,967 and 1,378,571, respectively.1 In the Southern region, Virginia has the highest concentration of veterans, with around 7,144 per 100,000 people.2 Figure 1 shows a visual representation of the estimated number of veterans in each state per 100,000 people in 2026.
FIGURE 1. Veteran Population by State, 2026 (per 100k)

Furthermore, the geographic distribution of veterans within an individual state can help policymakers identify where service providers are most needed. For example, Figure 2 shows the percentage of veterans in each of Florida’s counties as well as the distribution of VA facilities and provider locations. The data show that metropolitan counties along Florida’s Atlantic coast have higher percentages of veteran residents. As such, VA and Florida Department of Veterans’ Affairs (FDVA) facilities (Figure 3) are concentrated in similar areas, which often coincide with military base locations.
FIGURE 2. Distribution of Florida Veterans and VA Facilities by County (2024)
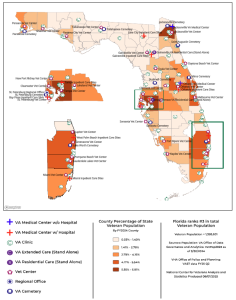
FIGURE 2. FDVA Facility Distribution
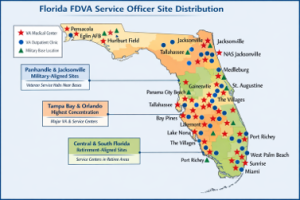
However, basing service location solely on population can lead to access limitations. Figures 2 and 3 also highlight that in less concentrated areas, typically rural, inland areas, there are fewer readily available services and facilities for veterans. This has the potential to limit access for veterans who live in these areas and hinder access to services and benefits.
Age
Within each state’s population, veterans’ ages range from under 20 years to over 85. Table 1 provides population age data for veterans in each state. Knowing the age of a state’s veteran population can provide insight into the stage of life and the corresponding needs of that population.
Table 2 identifies the median age for each state. Age demographics in the context of geographic location can also provide insight into a population’s goals. For example, Texas and Virginia have a slightly younger veteran population than their peers, while Florida’s is slightly older. For example, states such as Texas and Virginia have relatively younger veteran populations, which may reflect higher concentrations of transitioning service members. Florida’s older veteran population may reflect its role as a retirement destination.
TABLE 1. Veteran Population Age by State (2025)
| STATE | <20 | 20–24 | 25–29 | 30–34 | 35–39 | 40–44 | 45–49 | 50–54 | 55–59 | 60–64 | 65–69 | 70–74 | 75–79 | 80–84 | 85+ | TOTAL |
|---|---|---|---|---|---|---|---|---|---|---|---|---|---|---|---|---|
| AL | 226 | 2,830 | 9,646 | 14,854 | 19,187 | 21,565 | 22,258 | 26,172 | 33,085 | 37,096 | 36,175 | 32,887 | 37,640 | 23,798 | 18,266 | 335,685 |
| AR | 197 | 1,695 | 5,197 | 8,637 | 11,245 | 12,333 | 12,101 | 14,239 | 18,462 | 20,168 | 19,945 | 19,559 | 26,605 | 13,063 | 13,268 | 196,712 |
| FL | 711 | 11,088 | 36,716 | 53,096 | 68,574 | 81,361 | 83,240 | 91,216 | 117,253 | 143,774 | 144,175 | 122,129 | 180,633 | 126,657 | 117,949 | 1,378,571 |
| GA | 448 | 7,463 | 24,902 | 35,241 | 41,711 | 44,252 | 43,943 | 50,123 | 64,685 | 71,207 | 67,430 | 55,549 | 68,084 | 41,285 | 34,417 | 650,739 |
| KY | 146 | 2,368 | 8,258 | 11,198 | 14,230 | 16,181 | 16,345 | 18,951 | 25,275 | 28,318 | 25,849 | 23,620 | 31,820 | 16,154 | 15,095 | 253,808 |
| LA | 222 | 2,659 | 8,064 | 10,586 | 3,492 | 18,120 | 18,881 | 20,567 | 25,685 | 22,243 | 21,726 | 22,763 | 29,534 | 17,990 | 14,513 | 247,044 |
| MS | 161 | 1,909 | 5,615 | 8,456 | 10,788 | 12,519 | 12,932 | 13,872 | 17,759 | 18,965 | 18,335 | 16,587 | 18,294 | 11,532 | 9,830 | 177,553 |
| MO | 267 | 3,596 | 11,701 | 18,455 | 21,824 | 24,143 | 22,571 | 25,332 | 33,298 | 38,911 | 38,587 | 36,269 | 47,288 | 29,918 | 25,459 | 377,618 |
| NC | — | — | — | — | — | — | — | — | — | — | — | — | — | — | — | — |
| OK | 330 | 7,239 | 26,620 | 37,163 | 43,047 | 45,639 | 44,312 | 49,701 | 60,746 | 67,632 | 65,837 | 58,923 | 82,759 | 47,116 | 38,442 | 675,487 |
| SC | 167 | 3,152 | 9,530 | 14,113 | 18,296 | 21,282 | 20,020 | 20,505 | 24,069 | 24,368 | 24,711 | 25,386 | 32,207 | 20,616 | 16,236 | 274,659 |
| TN | 330 | 5,777 | 15,956 | 18,251 | 22,735 | 24,640 | 24,992 | 27,839 | 34,300 | 39,835 | 37,869 | 32,677 | 47,853 | 26,855 | 24,934 | 384,872 |
| TX | 860 | 18,062 | 64,811 | 88,789 | 111,107 | 128,659 | 121,871 | 123,813 | 143,047 | 135,150 | 131,894 | 124,482 | 152,659 | 97,413 | 76,351 | 1,518,967 |
| VA | 274 | 6,214 | 21,774 | 34,338 | 44,487 | 55,495 | 56,527 | 58,776 | 66,422 | 71,382 | 65,488 | 53,527 | 66,406 | 36,077 | 33,647 | 670,835 |
| WV | 51 | 777 | 2,763 | 4,197 | 5,693 | 6,664 | 7,582 | 9,383 | 11,559 | 12,351 | 10,939 | 11,107 | 15,990 | 10,455 | 8,456 | 117,969 |
TABLE 2. Median Age of Veteran Population in Each CSG South Member State
| STATE | MEDIAN AGE |
|---|---|
| AL | 61.4 |
| AR | 61.6 |
| FL | 66.2 |
| GA | 61.8 |
| KY | 61.7 |
| LA | 61.5 |
| MS | 61.6 |
| MO | 61.9 |
| NC | 61.8 |
| OK | 61.7 |
| SC | 61.9 |
| TN | 61.8 |
| TX | 56.3 |
| VA | 56.8 |
| WV | 62.1 |
SOURCE: Author’s calculations
Veteran age distributions across Southern states show a high degree of regional consistency, with most states’ median age falling between 61 and 62 years. Analyzing this data further suggests that subregional differences, driven by migration patterns and military workforce dynamics, exist across the region. These subregional differences create meaningful variations that could have policy implications for which service gaps may be a priority at the state level.
Table 3 divides the CSG South member states into three geographic subregions. Additionally, there is a subregion entitled “Military-Influence States.” The states in this subregion have a high active-duty presence that later transitions to veteran status, as evidenced by the lower median age for this group.
TABLE 3. Median Age of Veterans by Subregion (Southern States)
| SUB REGION | STATES INCLUDED | STATE MEDIAN AGES | SUBREGIONAL AVERAGE (MEDIAN AGE) | RANGE (MIN–MAX) |
|---|---|---|---|---|
| Interior South | AR, KY, TN, MO, OK | AR (61.6), KY (61.7), TN (61.8), MO (61.9), OK (61.7) | 61.7 | 61.6 – 61.9 |
| South Atlantic | FL, GA, SC, NC, VA, WV | FL (66.2), GA (61.8), SC (61.9), NC (61.8), VA (56.8), WV (62.1) | 61.8 | 56.8 – 66.2 |
| Gulf Coast | AL, MS, LA, TX, FL | AL (61.4), MS (61.6), LA (61.5), TX (56.3), FL (66.2) | 61.4 | 56.3 – 66.2 |
| Military-Influence States | TX, VA, NC, GA, FL | TX (56.3), VA (56.8), NC (61.8), GA (61.8), FL (66.2) | 60.6 | 56.3 – 66.2 |
SOURCE: Author’s calculations
Sex
Though most veterans are male, the percentage of female veterans is on the rise. Currently, about 88 percent of veterans are male. The population of female veterans has been steadily increasing over the years. In 2000, women represented approximately 4 percent of veterans. By 2040, the veteran population is projected to be comprised of 18 percent females.7
Service Branch
Table 4 provides data on the number of veterans served in each branch of the military and further specifies that data by sex. This information helps one understand the backgrounds of our veterans. One way this information may be used is when considering the scale of services near a particular military base. For instance, nearly 44 percent of all living veterans are Army veterans. These demographic trends help inform how states are designing targeted policy responses to better meet the needs of their veteran populations.
TABLE 4. Approximate Number of Veterans by Branch and Sex in 2025
(Reported to the Nearest 1,000)
| BRANCH | FEMALE | MALE | TOTAL |
|---|---|---|---|
| Army | 906,000 | 6,789,000 | 7,696,000 |
| Navy | 409,000 | 3,245,000 | 3,655,000 |
| Air Force | 467,000 | 2,558,000 | 3,025,000 |
| Marines | 119,000 | 1,912,000 | 2,031,000 |
| Non-Defense* | 31,000 | 183,000 | 214,000 |
| Reserve | 181,000 | 787,000 | 968,000 |
| TOTAL | 2,113,000 | 15,475,000 | 17,588,000 |
Policy and Programs Vignettes
The following examples highlight selected policy approaches across five states. These examples are not exhaustive but illustrate a range of strategies states are using to address veterans’ needs. The states mentioned are Alabama, Florida, Georgia, Missouri, and Texas. Though not a comprehensive list of ways states have endeavored to support veterans, the policies and programs named offer an overview of the primary tracks states have been taking recently.
Alabama — Benefit and Service Accessibility
There is a gap between benefits for which veterans are eligible and those they receive. During Fiscal Year 2023, of the approximately 18.3 million living veterans, about 9.2 million (roughly half) accessed at least one VA-administered benefit or service, though participation varies by program, and just over half of those users engaged with more than one benefit.9 The use of VA healthcare and disability compensation has increased from 74 percent in 2010 to 84 percent in 2023.10 Viewing these data in tandem suggests that while healthcare and disability service usage is improving, most of the other VA-provided services and benefits are going unused.
Several factors contribute to underutilization, but among the most frequently reported reasons veterans do not receive their benefits are the complexity of the system and lack of awareness.11 One study found that veterans who do use VA services are more likely to have served longer in the military and in combat,12 which could suggest that those with more exposure to VA services — whether through simply having more opportunities to learn about VA services due to longer military service or through VA-targeted outreach to combat veterans — are more likely to utilize services and apply for benefits.
In 2025, Alabama established the Alabama Veterans Resource Center (AVRC) to streamline access to and delivery of veteran benefits. AVRC was created through a one-time appropriation from the state’s General Fund of $5 million (Senate Bill 0070 (2025)). In addition to this initial funding, the center receives both public and private funding through partnerships, grants, and donations.13
AVRC streamlines services by bridging the benefits offered by the VA with those provided by local partners. It connects veterans with five types of services: employment and workforce training, health and wellness support, education and skills development, housing and financial assistance navigation, and community and peer support.14 To promote accessibility for all Alabamians, AVRC is headquartered in Montgomery, AL, and has a digital hub.15
As dictated by the enacted legislation, the AVRC is led by a board of eleven members who meet the
following criteria:16
- Three members appointed by the Governor, one of whom shall be a female veteran.
- One member appointed by the Speaker of the House of Representatives.
- One member appointed by the Lieutenant Governor in his or her role as Chair of the Alabama Military Stability Commission.
- One member appointed by the President Pro Tempore of
the Senate. - The Commissioner of the State Department of Veterans Affairs, who shall serve as an ex officio member and vice chair of the board. * Non-defense includes Coast Guard, Public Health Service (PHS) and National Oceanic and Atmospheric Administration (NOAA).
- The Commissioner of the Department of Mental Health,
who shall serve as an ex officio member. - The Secretary of the Alabama Department of Workforce, who shall serve as an ex officio member and chair of the board.
- The Minority Leader of the House of Representatives, or his or her designee.
- The Minority Leader of the Senate, or his or her designee.
While the AVRC has only recently been created and, therefore, has not undergone substantial evaluation, it highlights how states can aggregate resources and eliminate obstacles for veterans seeking benefits and support in their reintegration. The AVRC reflects a policy approach aimed at improving coordination across service providers and reducing barriers to access.
Florida — Workforce Development
Though veterans leave the military with a unique and invaluable set of experiences and skills, finding civilian employment can prove quite challenging. Veterans might struggle with translating their experiences into marketable skills for the civilian job market. This may contribute to unemployment and underemployment.
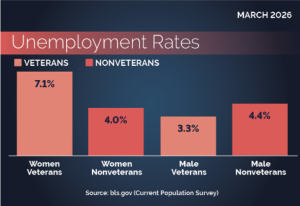
Across all demographics, unemployment has signaled the onset of other challenges (namely mental health conditions and substance abuse disorders) due to the relationship between socio-economic factors and mental wellness.17 As of March 2026, the veteran unemployment rate was 3.8 percent.18 Figure 4 shows how the veteran unemployment rate compares to that of non-veterans.
FIGURE 4. Unemployment Rates by Sex and Veteran Status
Underemployment occurs when a person is employed but in a position that does not utilize their skills, potentially resulting in lower compensation. In 2024, approximately one-third of post-9/11 veterans report underemployment.20 As this measure is typically based on self-reported perceptions of whether employment aligns with an individual’s skills, experiences, or desired hours, it may capture a range of circumstances and does not reflect a single standardized economic definition. Underemployment can present similar challenges to unemployment, including lowered self-esteem, financial strain, and worsened mental health.
To address the challenges, Florida established Veterans Florida (VF), a nonprofit organization that administers workforce and training programs, in 2014. Veterans Florida is a nonprofit organization led by an eleven-member Board of Directors who represent active or retired military and their spouses. VF is designed to manage Florida’s Veteran Education and Training Services Program, which connects veterans with educational opportunities, workforce development training, and potential employers.
The primary goal of Veterans Florida is to help veterans and their spouses find and retain employment opportunities in the state through programs like VF’s SkillBridge and Veterans Florida Entrepreneur Program. Florida established the nation’s first SkillBridge initiative in 2021 through House Bill 0435. SkillBridge is a program designed to assist participants in developing their skills and support workforce transition. The Veterans Florida Entrepreneur Program was established in 2016. It works to harness veterans’ and spouses’ skills and leverage them for entrepreneurial pursuits.21
Georgia — Justice Involvement and Mental Health
Substance abuse disorders and mental health conditions have been identified as concerning factors amongst the veteran population. The most recent data show that 14 percent of U.S. veterans reported having at least one substance use disorder.22 Commonly abused substances are alcohol, opioids, cannabis, and other illicit drugs (cocaine, methamphetamine, heroin, etc.).23 Substance abuse is often comorbid with other mental health conditions such as Post-Traumatic Stress Disorder (PTSD), depression, anxiety, and Bipolar Personality Disorder (BPD).24
Suicidality is another major mental health concern among veterans, and it is also often tied to substance abuse. In 2023, 60.9 percent of the veterans who died by suicide while receiving care from the Veterans Health Administration were diagnosed with a substance abuse disorder. Table 5 shows veteran suicide rates from 2018 to 2023. Table 6 shows the number of veteran suicides in each CSG South member state during 2023.
TABLE 5. Veteran Suicide Rates per 100,000
| CATEGORY | 2018 | 2019 | 2020 | 2021 | 2022 | 2023 |
|---|---|---|---|---|---|---|
| All Veterans | 33.0 | 32.5 | 32.5 | 33.8 | 34.7 | 35.2 |
| Female Veterans | 14.7 | 14.7 | 14.1 | 17.5 | 13.7 | 13.9 |
| Male Veterans | 35.0 | 34.5 | 34.6 | 35.7 | 37.3 | 37.8 |
Beyond facing higher risks of substance misuse and mental health challenges, veterans are more likely to have involvement with the justice system as defendants. One report suggests one-third of veterans report interaction with the justice system, compared to one-fifth of non-veterans.²⁷ While the relationship between veteran status and interaction with the justice system is multifaceted and cannot be attributed to a singular variable, there are data that show veterans with a history of substance abuse or mental illness are more likely to also have involvement with the justice system. Studies have shown that veterans with a substance abuse disorder are 2 to 3.5 times more likely to be arrested within their lifetime.²⁸˒²⁹
Georgia has implemented two major policies to improve veteran mental health and reduce veteran justice involvement — the Suicide Prevention Office (SPO) of the Georgia Department of Veterans Services (GDVS) and the Veterans Treatment Courts of the Georgia Accountability Courts. GDVS’s Suicide Prevention Office focuses on raising awareness, performing outreach to at-risk veteran communities, and connecting individuals with the population. The most recent data show that 14 percent of U.S. veterans reported having at least one substance use disorder.²² Commonly abused substances are alcohol, opioids, cannabis, and other illicit drugs (cocaine, methamphetamine, heroin, etc.).²³ Substance abuse is often comorbid with other mental health conditions such as Post-Traumatic Stress Disorder (PTSD), depression, anxiety, and Bipolar Personality Disorder (BPD).²⁴
Suicidality is another major mental health concern among veterans, and it is also often tied to substance abuse. In 2023, 60.9 percent of the veterans who died by suicide while receiving care from the Veterans Health Administration were diagnosed with a substance abuse disorder. Table 5 shows veteran suicide rates from 2018 to 2023. Table 6 shows the number of veteran suicides in each CSG South member state during 2023.
TABLE 6. Veteran Suicide Rates in 2023 by State
| STATE | RATE PER 100,000 |
|---|---|
| AL | 35.7 |
| AR | 51.1 |
| FL | 38.6 |
| GA | 30.0 |
| KY | 39.3 |
| LA | 32.0 |
| MS | 34.4 |
| MO | 37.5 |
| NC | 32.9 |
| OK | 56.9 |
| SC | 33.2 |
| TN | 48.2 |
| TX | 37.6 |
| VA | 25.0 |
| WV | 55.6 |
| National | 35.2 |
VA, state, and local mental health care providers. Since its inception, the SPO has identified key risk factors to veteran suicide such as firearm accessibility, which, according to GDVS’s data, accounts for 80 percent of veteran suicides.³⁰ Additionally, GDVS and SPO have launched a closed-loop referral system, reducing the time it takes for veterans to connect with a provider to only 1.6 days.³¹
In addition to GDVS’s efforts, in 2014, the Georgia General Assembly passed Senate Bill 320 (2014), establishing the veterans court division of Georgia’s accountability courts. These treatment courts are collaborative, therapeutic programs designed to help qualifying veterans avoid criminal charges and corrections. Georgia’s accountability court system comprises five diversion courts. Of the five accountability courts, 4.1 percent of participants in veterans’ treatment courts from FY2020 to FY2023 graduated at a rate of 64.6 percent.³² Moreover, the accountability courts save taxpayers almost $5,000 per participant over traditional adjudication and incarceration.³³
These programs are designed to address underlying behavioral health conditions and reduce justice involvement. Though the population experiences persistent risk factors, the Suicide Prevention Office and Veterans Treatment Courts are designed not only to identify those risk factors early but also to offer an alternative solution to standard corrections.
Missouri — Tax Relief
One way states have sought to ease the transition for veterans from active duty to civilian life is to offer tax relief — either through credit or exemption. This type of policy may reduce financial burdens for veterans as they reintegrate into civilian society.
Missouri provides property tax exemptions for disabled veterans. Current Missouri policy includes property tax credits for 100% disabled veterans, with maximum benefits of $750 for renters and $1,100 for homeowners, supported by dedicated state liaisons to guide veterans through income tax and benefit queries.34
Looking forward, proposed legislation House Joint Resolution 0115 (2026) seeks to amend the constitution to fully exempt the primary residences of 100% disabled veterans and their surviving spouses, introducing significant bipartisan support with 57 co-sponsors. Concurrently, there is an effort to expand this exemption to veterans of different disability statuses. House Bill 2535 (2026) aims to expand these benefits by establishing a tiered exemption program for a broader range of veterans and recipients of specialized honors, with funding proposed through new excise taxes on tobacco and hemp products.
While these policies may increase financial stability for disabled veterans, they may also have implications for local government revenue. Should House Joint Resolution 0115 be implemented in its current form, local governments would initially experience revenue reduction, rather than the state. Because the amendment does not include a reimbursement mechanism, this change could lead to adjustments in tax structures or state funding allocations over time (particularly school districts). The extent of these impacts may vary depending on participation rates and property values.
Nationally, the number of disabled veterans has been growing over the past five years. Nearly 6 million veterans receive disability compensation from the VA.35 Table 7 shows the number of new VA disability compensation recipients from fiscal year 2020 to 2024. Table 8 shows the number of veterans receiving VA disability compensation in each CSG South member state.
TABLE 7. New Disability Compensation Recipients
| COMBINED DEGREE | 2020 | 2022 | 2023 | 2024 | PERCENT CHANGE FY 2023 TO 2024 |
|---|---|---|---|---|---|
| 0 Percent | 437 | 336 | 667 | 946 | 42% |
| 10 Percent | 72,117 | 87,195 | 97,172 | 127,510 | 31% |
| 20 Percent | 20,174 | 23,203 | 25,952 | 33,234 | 28% |
| 30 Percent | 19,983 | 22,752 | 25,924 | 33,235 | 28% |
| 40 Percent | 17,377 | 21,662 | 24,750 | 31,364 | 27% |
| 50 Percent | 18,174 | 20,395 | 22,403 | 28,007 | 25% |
| 60 Percent | 18,398 | 23,361 | 26,317 | 33,612 | 28% |
| 70 Percent | 23,364 | 28,289 | 31,966 | 39,018 | 22% |
| 80 Percent | 16,519 | 22,639 | 25,445 | 29,542 | 16% |
| 90 Percent | 17,465 | 24,224 | 27,973 | 31,416 | 12% |
| 100 Percent | 34,628 | 48,848 | 58,402 | 70,035 | 20% |
| TOTAL | 258,636 | 322,904 | 366,971 | 457,919 | 25% |
TABLE 8. Number of Veterans Receiving VA Disability Compensation in Each CSG South Member State
| STATE | 2022 | 2023 | 2024 |
|---|---|---|---|
| AL | 120,962 | 127,361 | 135,288 |
| AR | 57,984 | 60,659 | 64,186 |
| FL | 446,270 | 472,784 | 503,513 |
| GA | 233,812 | 245,799 | 260,888 |
| KY | 74,151 | 77,064 | 80,856 |
| LA | 73,665 | 77,515 | 82,385 |
| MS | 53,296 | 56,094 | 60,073 |
| MO | 108,835 | 113,399 | 119,699 |
| NC | 239,894 | 253,167 | 269,721 |
| OK | 106,892 | 109,753 | 114,091 |
| SC | 130,132 | 137,598 | 146,870 |
| TN | 143,884 | 151,225 | 160,163 |
| TX | 569,520 | 602,649 | 642,981 |
| VA | 230,843 | 243,174 | 259,005 |
| WV | 38,663 | 39,849 | 41,515 |
Texas — Education
Continued education is one path veterans can use to support the transition from military service to civilian life. It may support career advancement, skill development, and financial outcomes. Additionally, education for veteran families may help address challenges associated with military service and may contribute to long-term educational and economic outcomes across generations.
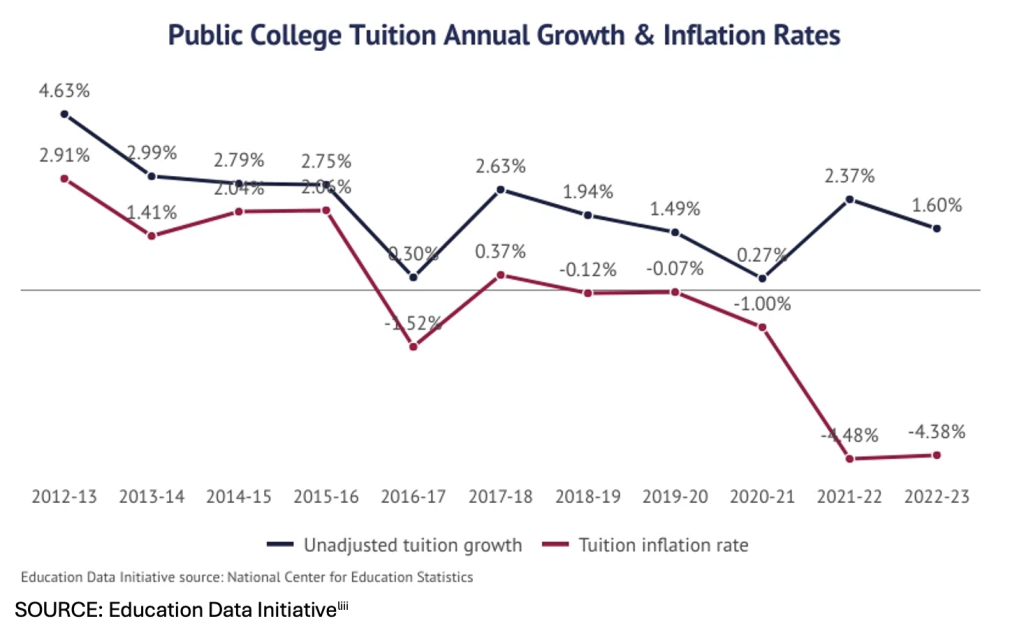
As college tuition has increased in recent years, veterans pursuing postsecondary education may encounter affordability challenges. After adjusting for inflation, college tuition was 312.4 percent higher in 2025 than it was in 1963.52 Figure 5 shows the annual growth rate of public college tuition in the United States compared to the tuition inflation rate (the cost of running a college).
FIGURE 5. Public College Tuition Annual Growth and Inflation Rates
The Hazlewood Act, established by the Texas Legislature in 1923, provides eligible veterans, spouses, and children with an exemption of up to 150 hours of tuition and most fees at public Texas institutions, excluding living expenses and books. Eligibility requires veterans to have served at least 181 days, received an honorable discharge, and met defined Texas residency requirements, with the 2009 Legacy Act allowing the transfer of unused hours to children. To support institutions, the state established the Permanent Fund Supporting Military and Veterans Exemptions (MVE) in 2013, which is funded through appropriations and gifts to offset waived revenue, though some costs may not be fully offset.
As tuition rates have risen, the program has been the subject of legislative and policy discussions regarding long-term financial sustainability and its potential relationship to tuition levels. For example, in 2025, Texas Senate Bill 1735, legislation that would have modified eligibility requirements by revising residency criteria, limiting the duration of benefits, and restricting benefit transfers, passed both chambers but was ultimately left unsigned by the governor. Additional legislation has also been introduced, including House Bill 1867 (2025) and House Bill 5619 (2025), which would expand Hazlewood eligibility to siblings of veterans and active-duty military, respectively.
Conclusion
Veterans are an ever-evolving population, and the policies designed to support them continue to adapt accordingly. Shifts in age distribution, service era, and geographic concentration suggest that ongoing evaluation of program outcomes, participation rates, and fiscal considerations may help inform how different approaches are functioning and where refinement may be needed. State policymakers across the CSG South region continue to explore a range of strategies to address the needs of veterans and their families. As demonstrated by examples provided from Alabama, Florida, Georgia, Missouri, and Texas, these efforts span multiple policy areas, including benefit accessibility, workforce development, mental health, justice involvement, tax policy, and education.
These strategies illustrate how states may tailor their approaches to demographic trends, regional economic conditions, and existing service delivery systems. In some cases, states have emphasized coordination across agencies and service providers to improve access and utilization, while in others, efforts have focused on expanding or modifying specific benefits and eligibility criteria.
At the same time, several policy approaches highlighted in this brief reflect potential trade-offs. Expanding benefits or eligibility may increase access to services but may also raise considerations related to long-term funding and program sustainability. Similarly, targeted interventions in areas such as workforce development or behavioral health may require coordination across multiple agencies and levels of government.
The examples in this brief highlight the role of both targeted and broad-based policy approaches. Targeted initiatives, such as specialized courts or workforce transition programs, may address specific barriers faced by subsets of the veteran population, while broader policies, such as tax exemptions or education benefits, can affect a wider group of eligible individuals. The variation in these approaches underscores the importance of aligning policy design with identified needs and available resources.
End Notes
- “Veteran Population — National Center for Veterans Analysis and Statistics.” 2016. Va.gov. 2016. https://www.va.gov/vetdata/veteran_population.asp.
- Review of Veterans by State 2026. n.d. World Population Review. World Population Review. Accessed March 26, 2026. https://worldpopulationreview.com/state-rankings/veterans-by-state.
- Ibid.
- “NCVAS State Summary Florida FY2024.” 2024. Va.gov. 2024. https://www.data.va.gov/stories/s/nge7-gsza/.
- “Florida Department of Veterans’ Affairs | Connecting Veterans to Federal and State Benefits They Have Earned.” n.d. Www.floridavets.org. https://www.floridavets.org/locations/.
- “Veteran Population – National Center for Veterans Analysis and Statistics.” 2016. Va.gov. 2016. https://www.va.gov/vetdata/veteran_population.asp.
- Administration, US Department of Veterans Affairs, Veterans Health. n.d. “Facts and Statistics – Women Veterans Health Care.” Www.womenshealth.va.gov. https://www.womenshealth.va.gov/materials-and-resources/facts-and-statistics.asp.
- “Veteran Population – National Center for Veterans Analysis and Statistics.” 2016. Va.gov. 2016. https://www.va.gov/vetdata/veteran_population.asp.
- “Use of va Benefits and Services: 2021 (Part 1).” 2021. Va.gov. 2021. https://www.data.va.gov/stories/s/59yt-v847.
- “Use of va Benefits and Services: 2023 (Part 3).” 2023. Va.gov. 2023. https://www.data.va.gov/stories/s/vcsz-q2jk.
- “Researchers Examine Why Health and Social Services Go Unused by New Veterans | Penn State University.” 2019. Psu.edu. 2019. https://www.psu.edu/news/research/story/researchers-examine-why-health-and-social-services-go-unused-new-veterans.
- Meffert, Brienna N., Danielle M. Morabito, Danielle A. Sawicki, Catherine Hausman, Steven M. Southwick, Robert H. Pietrzak, and Adrienne J. Heinz. 2019. “US Veterans Who Do and Do Not Utilize Veterans Affairs Health Care Services.” The Primary Care Companion for CNS Disorders 21 (1). https://doi.org/10.4088/pcc.18m02350.
- Natasha. 2026. “About the Alabama Veterans Resource Center.” Alabama Veterans Resource Center Foundation – Mission Forward AL. March 9, 2026. https://missionforwardal.org/about/.
- Natasha. 2026. “Programs & Services | Alabama Veterans Resource Center.” Alabama Veterans Resource Center Foundation – Mission Forward AL. March 9, 2026. https://missionforwardal.org/programs/.
- Natasha. 2026. “About the Alabama Veterans Resource Center.” Alabama Veterans Resource Center Foundation – Mission Forward AL. March 9, 2026. https://missionforwardal.org/about/.
- AL Code § 31-5B-5
- Yang, Yang, Lisi Niu, Saqib Amin, and Iftikhar Yasin. 2024. “Unemployment and Mental Health: A Global Study of Unemployment’s Influence on Diverse Mental Disorders.” Frontiers in Public Health 12 (1440403). https://doi.org/10.3389/fpubh.2024.1440403.
- 1U.S. Department of Labor. 2019. “Latest Unemployment Numbers | U.S. Department of Labor.” Dol.gov. 2019. https://www.dol.gov/agencies/vets/latest-numbers.
- Ibid.
- “Veterans Report Underemployment, Pay Frustration up to Four Years Post-Service | Social Science Research Institute.” 2024. Psu.edu. August 20, 2024. https://ssri.psu.edu/news/veterans-report-underemployment-pay-frustration-four-years-post-service.
- spire-tangerine-operator. 2025. “Florida Is First for Veteran Businesses.” Veterans Florida. October 6, 2025. https://veteransflorida.org/entrepreneur/.
- “Substance Use Disorders.” 2023. Www.hsrd.research.va.gov. June 20, 2023. https://www.hsrd.research.va.gov/research_topics/sud.cfm.
- Ngo, Thye Peng, Salomeh Keyhani, Samuel Leonard, and Katherine J Hoggatt. 2025. “Substance Use and Use Disorders among Veterans on Long-Term Opioid Therapy.” Drug and Alcohol Dependence Reports 16 (May): 100347–47. https://doi.org/10.1016/j.dadr.2025.100347.
- Common Comorbidities with Substance Use Disorders Research Report. Bethesda (MD): National Institutes on Drug Abuse (US); 2020 Apr. Available from: https://www.ncbi.nlm.nih.gov/books/NBK571451/
- Review of 2025 National Veteran Suicide Prevention Annual Report . 2026. U.S. Department of Veteran Affairs: Mental Health. Office of Suicide Prevention. https://mentalhealth.va.gov/suicide_prevention/data.asp.
- “VA.gov | Veterans Affairs.” n.d. Mentalhealth.va.gov. https://mentalhealth.va.gov/suicide_prevention/data.asp.
- Snowden, David L., Sehun Oh, Christopher P. Salas-Wright, Michael G. Vaughn, and Erika King. 2017. “Military Service and Crime: New Evidence.” Social Psychiatry and Psychiatric Epidemiology 52 (5): 605–15. https://doi.org/10.1007/s00127-017-1342-8.
- Elbogen, Eric B., Sally C. Johnson, Virginia M. Newton, Kristy Straits-Troster, Jennifer J. Vasterling, H. Ryan Wagner, and Jean C. Beckham. 2012. “Criminal Justice Involvement, Trauma, and Negative Affect in Iraq and Afghanistan War Era Veterans.” Journal of Consulting and Clinical Psychology 80 (6): 1097–1102. https://doi.org/10.1037/a0029967.
- Orak, Ugur, Katherine Kelton, Michael G. Vaughn, Jack Tsai, and Robert H. Pietrzak. 2022. “Homelessness and Contact with the Criminal Legal System among U.S. Combat Veterans: An Exploration of Potential Mediating Factors.” Criminal Justice and Behavior 50 (3): 392–409. https://doi.org/10.1177/00938548221140352.
- Portal, Citizen. 2026. “Georgia Veterans Agency Details Suicide-Review Findings, Expands Outreach and Launches Free Mental‑Health App.” Citizen Portal. February 19, 2026. https://citizenportal.ai/articles/7451634/Georgia/Legislative/Committees/HOUSE-OF-REPRESENTATIVES/Defense-and-Veterans-Affairs/Georgia-veterans-agency-details-suicide-review-findings-expands-outreach-and-launches-free-mentalhealth-app.
- Ibid.
- Review of COUNCIL of ACCOUNTABILITY COURT JUDGES OUTCOMES REPORT. 2025. Carl Vinson Institute of Government . https://cacj.georgia.gov/data-research/publications.
- “Publications.” 2020. Council of Accountability Court Judges. 2020. https://cacj.georgia.gov/data-research/publications.
- “Missouri Military and Veterans Benefits.” 2025. Army.mil. 2025. https://myarmybenefits.us.army.mil/Benefit-Library/State/Territory-Benefits/Missouri#Taxes.
- “NCVAS State Summary Alabama FY2024.” 2024. Va.gov. 2024. https://www.data.va.gov/stories/s/kcf9-n95s/.
- Review of Annual Benefits Report: Fiscal Year 2024. 2025. U.S. Department of Veteran Affairs: Mental Health. Veterans Benefits Administration. https://www.benefits.va.gov/REPORTS/abr/#:~:text=Table_title:%20View%20prior%20years’%20VBA%20Annual%20Benefits,report:%20View%20Report%20(1.43%20MB)%20%C2%BB%20%7C.
- “NCVAS State Summary Alabama FY2024.” 2024. Va.gov. 2024. https://www.data.va.gov/stories/s/kcf9-n95s/.
- “NCVAS State Summary Arkansas FY2024.” 2024. Va.gov. 2024. https://www.data.va.gov/stories/s/e93z-dwuz/.
- “NCVAS State Summary Florida FY2024.” 2024. Va.gov. 2024. https://www.data.va.gov/stories/s/nge7-gsza/.
- “NCVAS State Summary Georgia FY2024.” 2024. Va.gov. 2024. https://www.data.va.gov/stories/s/mzut-ta26/.
- “NCVAS State Summary Kentucky FY2024.” 2024. Va.gov. 2024. https://www.data.va.gov/stories/s/fnad-6fit.
- “NCVAS State Summary Louisiana FY2024.” 2024. Va.gov. 2024. https://www.data.va.gov/stories/s/2hu7-j4tq.
- “NCVAS State Summary Mississippi FY2024.” 2024. Va.gov. 2024. https://www.data.va.gov/stories/s/ryqk-cw29.
- “NCVAS State Summary Missouri FY2024.” 2024. Va.gov. 2024. https://www.data.va.gov/stories/s/jdiu-wgh7.
- “NCVAS State Summary North Carolina FY2024.” 2024. Va.gov. 2024. https://www.data.va.gov/stories/s/dp3p-x4xd.
- “NCVAS State Summary Oklahoma FY2024.” 2024. Va.gov. 2024. https://www.data.va.gov/stories/s/ezwf-ztxq.
- “NCVAS State Summary South Carolina FY2024.” 2024. Va.gov. 2024. https://www.data.va.gov/stories/s/uc7j-k29c.
- “NCVAS State Summary Tennessee FY2024.” 2024. Va.gov. 2024. https://www.data.va.gov/stories/s/44vf-wue7.
- “NCVAS State Summary Texas FY2024.” 2024. Va.gov. 2024. https://www.data.va.gov/stories/s/9z5v-j3g6.
- “NCVAS State Summary Virginia FY2024.” 2024. Va.gov. 2024. https://www.data.va.gov/stories/s/494i-w45t.
- “NCVAS State Summary West Virginia FY2024.” 2024. Va.gov. 2024. https://www.data.va.gov/stories/s/izpa-rx5n.
- Hanson, Melanie. “College Tuition Inflation Rate” EducationData.org, 2025-11-26, https://educationdata.org/college-tuition-inflation-rate
- Ibid.