
Regional Resource by Senior Policy Analyst, Cody Allen | callen@csg.org
DOWNLOADAccording to research from the First Five Years Fund (FFYF), a nationally recognized nonpartisan organization advocating for early childhood education, more than 14.85 million children under age five have both parents or guardians in the workforce, necessitating an increased focus on early childhood education (ECE) and prekindergarten opportunities for students and families.¹ However, this issue is compounded when only 23 percent of children aged three to four are enrolled in a state-funded prekindergarten program, and even fewer, with only 21.5 percent in the South. In more promising news, the percentage—nationwide—of children aged four enrolled in a state-funded prekindergarten program has more than doubled from around 14 percent in 2002 to more than 37 percent by 2024. Unfortunately, services for pre-k three students have not received the same levels of support and investment, rising only from 3 percent in 2002 to 8 percent in 2024.²
At the state level, prekindergarten funding typically falls into one of four structures—each with corresponding advantages and disadvantages:
- Incorporation into the Existing K–12 Per-Pupil Funding Formula: Distributed directly to local education agencies, this method can lead to more consistent and transparent funding, but may not take into account the unique needs or services involved in early childhood education;
- Separate Pre-K and Early Childhood Education Funding Formula: Structured similarly to the K-12 funding formula, but incorporating pre-k specific enrollment or input costs, a distinct ECE is more targeted but may also be more vulnerable to funding reductions and require significant state regulatory and administrative changes;
- Categorical Grants: Using a competitive grants process, this method better serves the mixed delivery systems typically seen in ECE—i.e., using a variety of public, private and facilities-based providers—but may also leave out providers who do not possess the administrative capacity to handle the grantmaking process and may also lead to funding that is more limited in support and scope; and/or
- Indirect Funding Support: Through tax credits or tuition subsidies, indirect funding supports provide flexibility to families to select the provider that best serves their child’s needs. However, indirect funding models may feature less oversight and quality standards than directly funded models. They also place a high initial burden on families to pay any upfront costs associated with the education while awaiting the refund or credit.³
FIGURE 1. Growth Over Time in the Percentage of 3-and-4-Year-Olds Enrolled in State-Funded Preschool
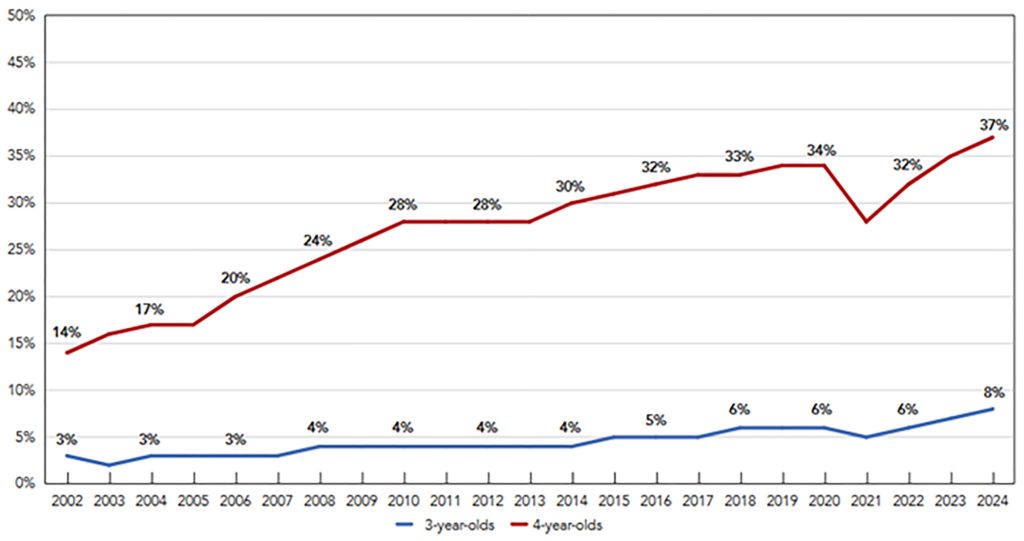
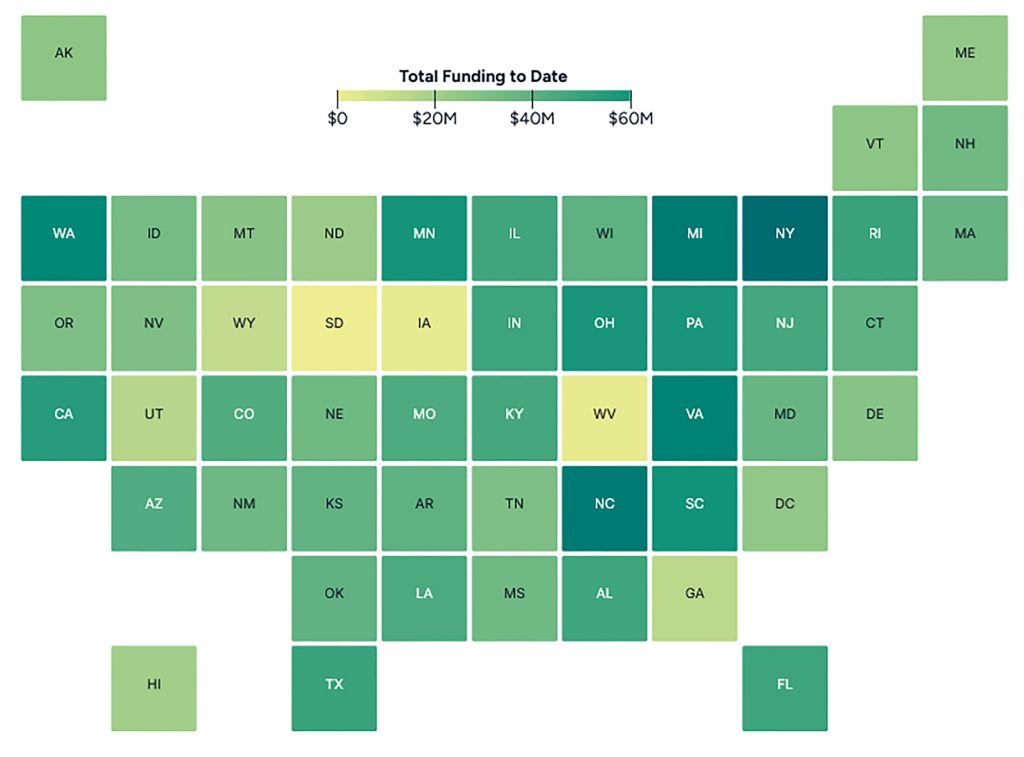
FIGURE 2. State Comparison of 3-and-4-Year-Olds Served by State-Funded Pre-K (2024)*
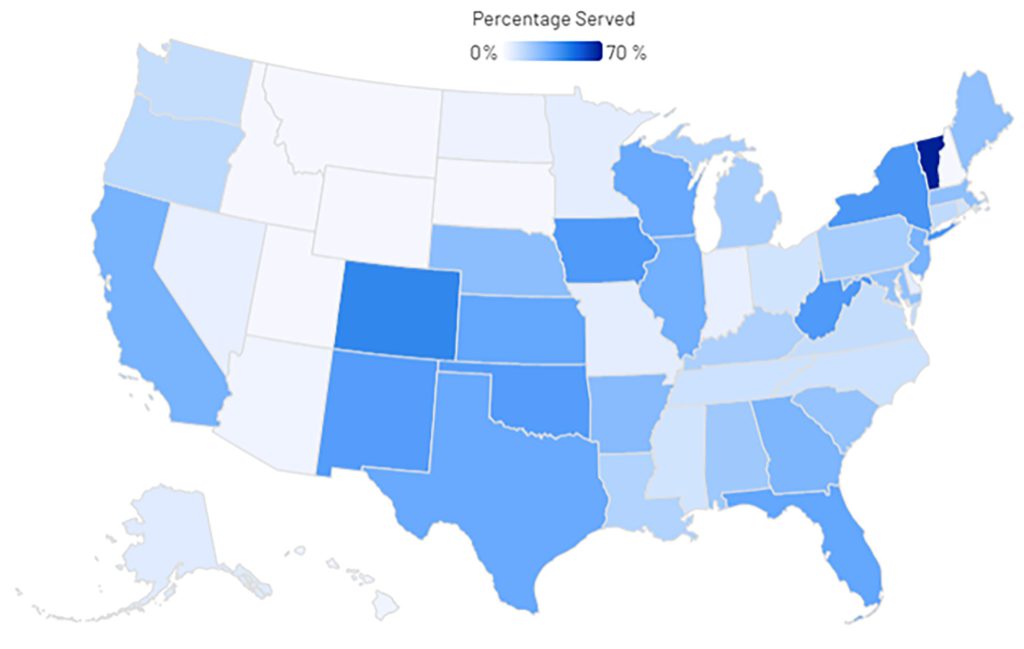
*Excludes federal and/or federal-state match funds and programs.
Compared to traditional K–12 school funding, preschool funding varies widely among states, with many using federal funds, appropriated monies out of the state general fund, utilizing a dedicated revenue stream, writing early childhood education into existing per-pupil funding formulas, or a combination of one or more of these models. Less than half of states—21 plus Washington, D.C.—have a dedicated revenue source, or sources set aside for prekindergarten and early childhood education.⁷
By adding Pre-K funding to traditional student funding formulas or considering new funding streams—such as lotteries, sales taxes, or direct appropriations—states are using a variety of fiscal tools to address access gaps in early childhood education. This is all the more important when studies from groups such as the Southern Regional Education Board and ExcelinEd emphasize the connections between high-quality early learning opportunities and positive long-term academic and career outcomes.⁸⁻⁹ While approximately eight states in the U.S. have universal eligibility for prekindergarten, only four—including Florida and Oklahoma in the South—are considered to have full universal programs. Alabama, Georgia and West Virginia join the Sunshine and Sooner States in leading the country in having universal eligibility programs.
This CSG South Regional Resource examines how states fund and support early learners—particularly those in Pre-K Three and Pre-K Four. While a brief note on federal funding for early childhood programs is included, this resource focuses on the state role.
A Brief Look at Federal Pre-K Programs and Funding
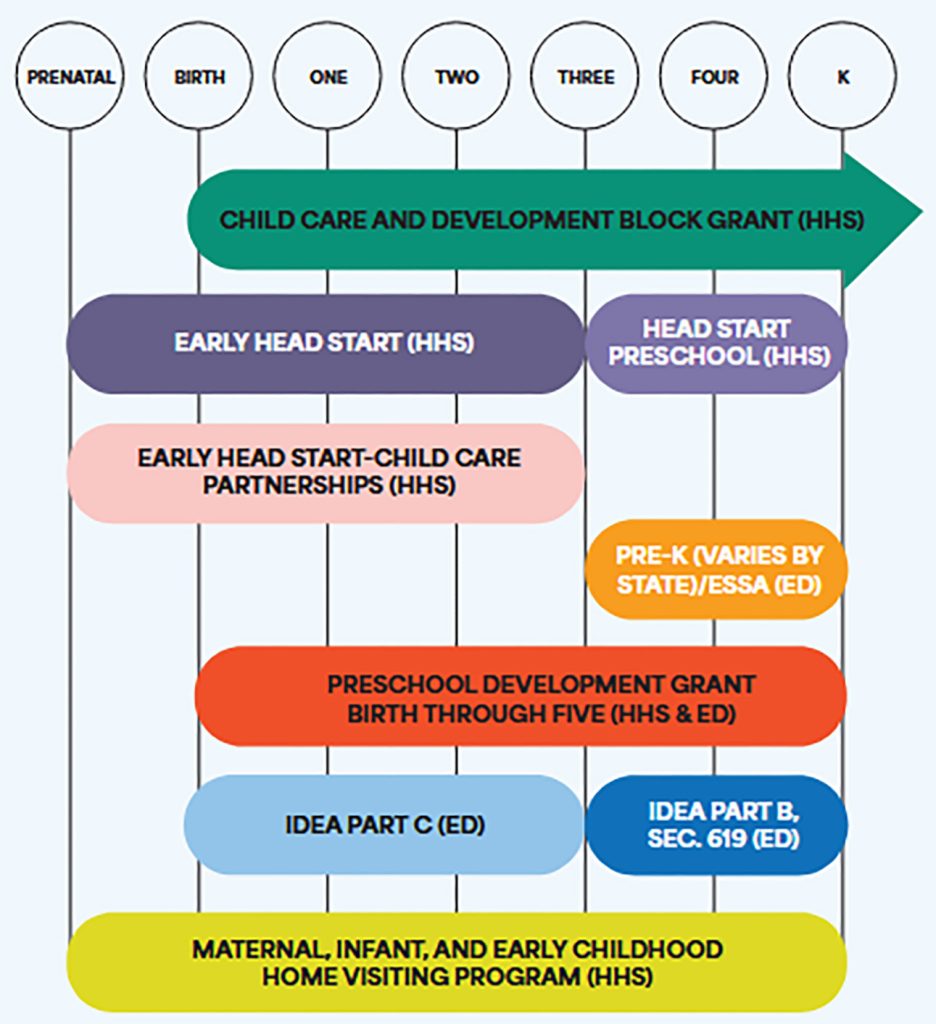
FIGURE 3. Comparison of Federally Funded ECE Programs by Age Groups Served
Head Start Preschool and Early Head Start
The most well-known federal early childhood education funding program is Head Start, which provides early childhood education and wraparound support for children from low-income families—those at or below 100 percent of the 2026 federal poverty levels or $21,640 for a family of two, $27,320 for a family of three, or $33,000 for a family of four.¹¹ For Fiscal Year 2024, this program comprised nearly half of all federal early childhood education spending, approximating more than $12.3 billion.¹² Head Start, which serves children ages three to five, and Early Head Start, a birth-to-three program, are competitive grant programs distributed directly to the grantees or service providers and not to states. In 2024, most Head Start Preschool-Funded Programs were center-based, with more than 1,020 hours of care and instruction, including 10 percent funded for at least 10 hours per day year-round. Comparatively, Early Head Start, which serves children from birth to age two, featured more than a quarter (28 percent) of funded programs in a home-based setting.¹³
Additionally, only 14 states nationally—including Alabama, Missouri and Oklahoma in the South—provide state supplements to the federal Head Start and Early Head Start programs and have done so continuously. Missouri—through two distinct programs, a voluntary foundation formula program for school districts and a competitive grant program for providers—provides nearly $6 million in annual supplemental appropriations to federal Early Head Start programs. In 2014, Missouri lawmakers passed House Bill 1689 to allow the optional counting of students aged three to five in the funding formula if they qualify for the free and reduced lunch program.¹⁵ Limited to 4 percent of a school or district’s total average daily membership, the funding is only available if a school district offers a voluntary prekindergarten program for income-qualifying families. Providers may not claim funding from both programs for the same students.¹⁶
TABLE 1. Comparison of Federally Funded ECE Programs by Age Groups Served
| State | Reported Annual Enrollment | Federally Funded Annual Operations per State | ||||
|---|---|---|---|---|---|---|
| Head Start Preschool | Early Head Start | Head Start Preschool | Per-Pupil Estimate | Early Head Start | Per-Pupil Estimate | |
| Alabama | 8,555 | 2,977 | $101,641,985 | $11,881 | $62,878,724 | $21,121 |
| Arkansas | 4,050 | 3,187 | $50,946,741 | $12,579 | $66,049,488 | $20,725 |
| Florida | 27,754 | 9,612 | $311,518,804 | $11,224 | $195,998,054 | $20,391 |
| Georgia | 16,039 | 4,160 | $194,739,301 | $12,142 | $88,676,664 | $21,317 |
| Kentucky | 10,197 | 2,964 | $140,423,849 | $13,771 | $65,049,357 | $21,947 |
| Louisiana | 13,035 | 3,424 | $149,495,194 | $11,469 | $65,605,981 | $19,161 |
| Mississippi | 14,964 | 3,609 | $187,493,040 | $12,530 | $77,008,192 | $21,338 |
| Missouri | 9,225 | 4,011 | $139,641,784 | $15,137 | $73,004,094 | $18,201 |
| North Carolina | 12,804 | 4,531 | $165,861,042 | $12,954 | $109,659,921 | $24,202 |
| Oklahoma | 7,747 | 3,483 | $86,451,202 | $11,159 | $73,811,073 | $21,192 |
| South Carolina | 8,257 | 2,720 | $103,148,286 | $12,492 | $52,642,604 | $19,354 |
| Tennessee | 12,760 | 2,495 | $161,599,631 | $12,665 | $56,004,864 | $22,447 |
| Texas | 47,286 | 14,166 | $540,532,752 | $11,431 | $285,688,754 | $20,167 |
| Virginia | 9,343 | 3,041 | $118,613,343 | $12,695 | $65,851,867 | $21,655 |
| West Virginia | 6,509 | 1,055 | $67,907,082 | $10,433 | $17,822,934 | $16,894 |
| AVERAGE | 13,902 | 4,362 | $168,000,936 | $12,304 | $90,383,505 | $20,674 |
Likewise, the Missouri Quality Prekindergarten Grant Program—designed to expand preschool options for low-income families—awards competitive grants ranging from $3,572 to $7,142 per preschooler for up to 9 months. Grantees must be eligible and qualified Early Head Start providers to receive the funds.¹⁷ Alternatively, both Alabama and Oklahoma, through line-items in the state budget, allocate direct funding for Head Start programs and indirect funding, in the case of Oklahoma, through the public-private Oklahoma Early Childhood Program partnership for Early Head Start programs.¹⁸⁻¹⁹
TABLE 2. CSG South State Supplemental Early Head Start and Head Start Funding (2023-2024)
| State and Program(s) | Program(s) Receiving Supplemental Funds | State Funds |
|---|---|---|
| Alabama – Early Childhood Education | Head Start | $5,138,672 |
| Missouri – Pre-K Foundation Formula | Early Head Start | $5,988,600 |
| Missouri – Quality Preschool Grant | Early Head Start | $5,988,600 |
| Oklahoma – Early Childhood Initiative | Head Start | $1,806,000 |
| Oklahoma – Early Childhood Initiative | Early Head Start | $12,000,000 |
Child Care and Development Fund Block Grant
The Child Care and Development Fund Block Grant (CCDBG) is issued to state governments to help make early childhood education more affordable for low-income working families. Most funds support ECE and child care for children aged five or younger; however, only an estimated 13 percent of the more than 6.3 million children who qualify for CCDBG services report accessing them. As of Fiscal Year 2024, the $8.7 billion in block grants primarily go towards directly subsidizing the costs of childcare and education, and states have much discretion over specific eligibility, application, payment and provider requirements.²¹
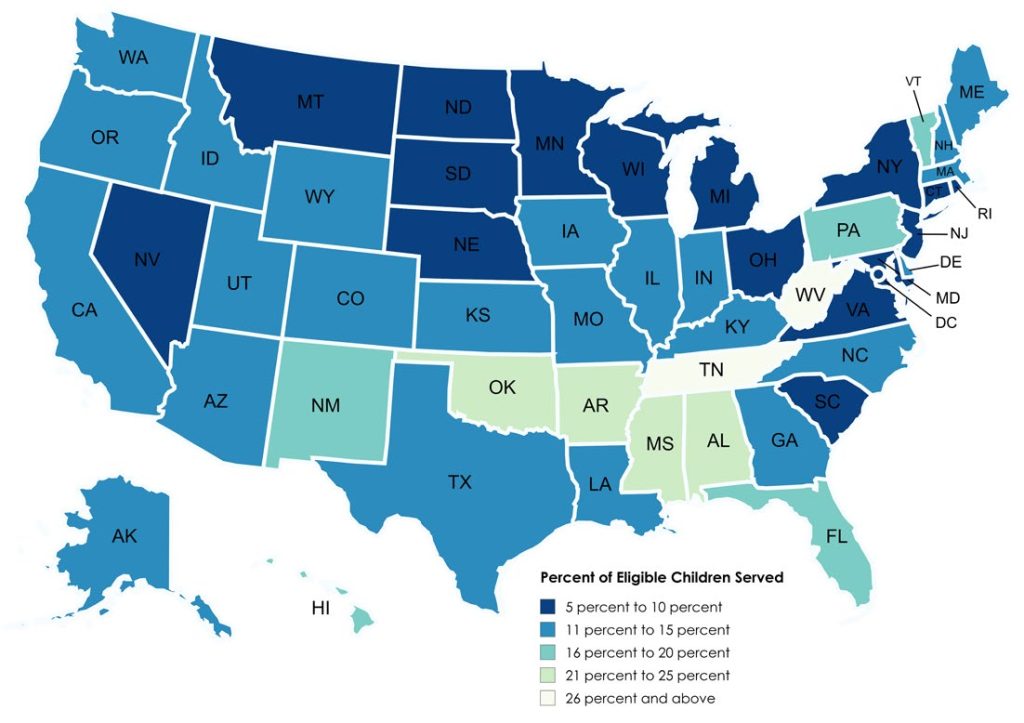
Nationally, an average of 13 percent of the eligible population of children aged five or younger is served by the CCDBG program, with the only states serving 25 percent or more of their eligible population belonging to the CSG South region—Oklahoma, West Virginia and Tennessee.²²
TABLE 3. Child Care and Development Block Grant Funds by State (FY 2023-2024)
| State | CCDBG Grant Funds FY 2023 | CCDBG Grant Funds FY 2024 † | ||
|---|---|---|---|---|
| Total Distributed | Per-Enrolled Child | Total Distributed | Per-Enrolled Child | |
| Alabama | $142,609,329 | $6,569 | $157,154,309 | $5,873 |
| Arkansas | $99,638,070 | $10,790 | $50,946,741 | $12,579 |
| Florida | $441,113,418 | $5,616 | $311,518,804 | $6,323 |
| Georgia | $317,820,970 | $8,085 | $194,739,301 | $11,236 |
| Kentucky | $140,087,611 | $9,761 | $140,423,849 | $12,179 |
| Louisiana | $141,504,238 | $9,209 | $149,495,194 | $9,376 |
| Mississippi | $94,348,400 | $6,776 | $187,493,040 | $6,844 |
| Missouri | $150,588,278 | $7,604 | $139,641,784 | $9,302 |
| North Carolina | $235,784,820 | $8,957 | $165,861,042 | $7,621 |
| Oklahoma | $121,009,871 | $6,943 | $86,451,202 | $5,925 |
| South Carolina | $140,670,054 | $15,820 | $103,148,286 | $13,494 |
| Tennessee | $211,736,964 | $6,616 | $161,599,631 | $4,532 |
| Texas | $859,633,625 | $8,854 | $540,532,752 | $10,778 |
| Virginia | $153,733,954 | $12,578 | $118,613,343 | $14,672 |
| West Virginia | $49,333,493 | $8,203 | $67,907,082 | $6,081 |
| CSG South Avg. | $219,974,206 | $8,825 | $168,000,936 | $9,596 |
† Estimated.
FIGURE 4. Percentage of Eligible Children Age 5 and Younger Served by CCDBG (2024)
Individuals with Disabilities Education Act (IDEA) – Parts B and C
Through Part B Section 619 of the federal IDEA, preschool grants support facilities serving children ages three through five with developmental delays or disabilities. As of Fiscal Year 2024, this appropriation was more than $420 million—an increase of approximately $1,066 per child over the Fiscal Year 2023 budget.²⁷
Additionally, Part C, which constitutes the Early Learning and Early Childhood Grant program, sends funding directly to states to operate comprehensive statewide programs of early intervention services for infants and toddlers ages birth to three with disabilities. In Fiscal Year 2024, this amounted to nearly $540 million.²⁸
TABLE 4. Comparison of Federal IDEA Parts B and C Funding to States for ECE (Fiscal Year 2024)
| State | IDEA Preschool Grants (Part B, Sec. 619) | Per-Child Amount | IDEA Early Intervention Grants (Part C) | Per-Child Amount |
|---|---|---|---|---|
| Alabama | $6,182,504 | $1,324 | $7,574,760 | $1,672 |
| Arkansas | $5,904,428 | $595 | $4,858,017 | $2,873 |
| Florida | $20,530,932 | $884 | $30,061,713 | $1,673 |
| Georgia | $11,021,675 | $1,085 | $17,077,887 | $1,935 |
| Kentucky | $11,241,786 | $963 | $7,226,512 | $1,551 |
| Louisiana | $7,111,602 | $1,070 | $7,377,947 | $1,128 |
| Mississippi | $4,649,156 | $1,170 | $4,341,166 | $2,257 |
| Missouri | $6,621,358 | $565 | $9,658,351 | $1,112 |
| North Carolina | $12,532,895 | $995 | $16,461,811 | $1,576 |
| Oklahoma | $4,089,078 | $813 | $6,030,335 | $2,224 |
| South Carolina | $7,859,585 | $1,187 | $8,005,391 | $935 |
| Tennessee | $7,629,788 | $741 | $11,301,720 | $1,195 |
| Texas | $25,698,103 | $719 | $52,273,960 | $1,635 |
| Virginia | $10,107,218 | $810 | $13,117,857 | $1,053 |
| West Virginia | $3,834,657 | $1,078 | $2,587,723 | $587 |
| CSG South Avg. | $9,667,651 | $862 | $13,197,010 | $1,468 |
Preschool Development Grants Birth Through Five
These PDG B-5 competitive grants are provided directly to states to support collaboration and communication among birth-to-five programs and services by building on existing federal, state and local investments. Since 2015, the amounts awarded to CSG South member states have ranged from $2 million in West Virginia to more than $75 million in North Carolina. In Fiscal Year 2024, more than $315 million in grants for state-level initiatives were awarded.³⁰
FIGURE 5. Map of Federal PDG B-5 Funding to States Since 2015
Child and Dependent Care Tax Credit
Unlike the other federal supports, these funds are provided via a tax credit instead, allowing filers to claim a credit of up to $3,000 for the costs of caring for a qualifying family member—including a dependent under age 13—for early childhood or general education costs, before or after school care, summer school or camps and other forms of child care.³² The amounts vary from year to year based on the number of filings and dependents and, as such, are difficult to formalize into a per-pre-k-student standard of comparison.
Universal Pre-K Models in Five Southern States
Collectively, states spend more than $13.7 billion to support state pre-K programs for the more than 1.7 million children served, averaging nearly $8,000 per pupil. In the South, per-pupil funding ranges from more than $8,100 in West Virginia to $2,864 in Florida, with a regional average of $5,660. This report focuses on the five CSG South member states with “universal” prekindergarten policies—defined as eligibility based solely on age and intended to enroll all eligible children who wish to participate, as well as states meeting the first part of the definition but not necessarily making pre-K available to all eligible students.³³
TABLE 5. Comparison of CSG South State-Funded Prekindergarten Statistics (2024)
| State | State-Funded Pre-Kindergarten Demographics | State-Funded Pre-Kindergarten Demographics | State Pre-K Funding (2024) | State Pre-K Funding Per-Pupil (2024) |
|---|---|---|---|---|
| Number of 3-to-4-Year-Olds Enrolled | Percentage of 3- and 4-Year-Olds Served | |||
| Alabama | 24,640 | 21.0% | $181,550,866 | $7,368 |
| Arkansas | 19,004 | 26.0% | $115,274,454 | $6,066 |
| Florida | 151,449 | 33.0% | $433,804,469 | $2,864 |
| Georgia | 71,526 | 28.0% | $457,779,908 | $6,400 |
| Kentucky | 18,978 | 18.0% | $130,128,152 | $6,857 |
| Louisiana | 19,515 | 17.0% | $110,765,377 | $5,676 |
| Mississippi | 7,145 | 10.0% | $31,794,188 | $4,450 |
| Missouri | 8,694 | 6.0% | $42,609,450 | $4,901 |
| North Carolina | 27,304 | 11.0% | $194,318,020 | $7,117 |
| Oklahoma | 36,359 | 36.0% | $197,385,755 | $5,429 |
| South Carolina | 27,125 | 23.0% | $115,624,307 | $4,263 |
| Tennessee | 17,633 | 11.0% | $86,437,438 | $4,902 |
| Texas | 247,466 | 32.0% | $1,061,419,621 | $4,289 |
| Virginia | 24,993 | 13.0% | $152,943,300 | $6,119 |
| West Virginia | 13,375 | 37.0% | $109,570,771 | $8,192 |
| CSG South Avg. | 47,680 | 21.5% | $228,093,738 | $5,660 |
Alabama
The Alabama Legislature enacted Senate Bill 132 (2000) to create an Office of School Readiness within the state Department of Children’s Affairs to develop, implement, and operate a voluntary prekindergarten program for four-year-olds in the state, utilizing combinations of federal and state, and public or private funds as necessary. As funds become available in future years from legislators, it was also directed to collaborate with each county to ensure all are participating in school readiness programs—including preschool and/or prekindergarten programs. In 2015, lawmakers passed House Bill 233 to establish the Department of Early Childhood Education under the Office of the Governor—replacing the preexisting Department of Children’s Affairs—to reorient the department’s focus toward a comprehensive statewide system for early learning and care.
The Alabama First Class Pre-K Program (FCPK), administered by the Office of School Readiness within the department, is a fully funded, full-day preschool program for four-year-olds. The state Education Trust Fund funds the program through competitive grants at three levels for prekindergarten programs:
- Pre-K Excellence Grants: Amounts up to $48,300 awarded to assist programs in reaching high-quality standards, but not designed as a primary means of pre-k funding.
- Pre-K Tiered Grants: Designated as a primary source of pre-k funding, including amounts between $84,000–$98,000 awarded to classrooms serving a large share of Free and Reduced Lunch Eligible students.
- New Classroom Grants: Approximately $120,000 per grant awarded to cover instructional materials, equipment, and general operational expenses in new pre-k classrooms for the first year.
Regardless of the qualifying grants, grantees must provide at least a 25 percent match to any awards based on a sliding scale.
In the decade since its expansion in 2013, the FCPK program has more than quadrupled, with more than 23,000 enrolled four-year-olds during the 2023 school year—including more than 60 percent of enrollees whose family income is below the federal poverty level. With nearly 1,500 classrooms statewide, every county in Alabama has at least two available FCPK classrooms, with most, on average, having 21 FCPK classrooms. For the Fiscal Year 2022–2023 biennium, lawmakers budgeted more than $173.7 million for the pre-k program—or approximately $118,000 per classroom and $7,300 per enrolled student. A year-over-year (YoY) comparison using the publicly available data, dating back to Fiscal Year 2005–2006, is illustrated in the table below.
‡For state historic enrollment and funding trends, nominal—or non-inflation adjusted—spending is utilized.
TABLE 6. Historic Enrollment and Funding Trends in Alabama’s FCPK Program
| Budget Year | FCPK Nominal Appropriations | Appropriations YoY Change | FCPK Classrooms | Per FCPK Classroom | Per Classroom YoY Change | FCPK Students | Per FCPK Student | Per Student YoY Change |
|---|---|---|---|---|---|---|---|---|
| 2006 | $4,326,050 | – | 57 | $75,896 | – | 1,026 | $4,216 | – |
| 2007 | $5,369,898 | 24.1% | 59 | $91,015 | 19.9% | 1,062 | $5,056 | 19.9% |
| 2008 | $10,000,000 | 86.2% | 128 | $78,125 | -14.2% | 2,265 | $4,415 | -12.7% |
| 2009 | $15,490,831 | 54.9% | 185 | $83,734 | 7.2% | 3,384 | $4,578 | 3.7% |
| 2010 | $18,376,806 | 18.6% | 215 | $85,474 | 2.1% | 3,870 | $4,749 | 3.7% |
| 2011 | $18,376,806 | 0.0% | 217 | $84,686 | -0.9% | 3,870 | $4,749 | 0.0% |
| 2012 | $17,998,620 | -2.1% | 217 | $82,943 | -2.1% | 3,906 | $4,608 | -3.0% |
| 2013 | $19,087,050 | 6.0% | 217 | $87,959 | 6.0% | 3,897 | $4,898 | 6.3% |
| 2014 | $28,462,050 | 49.1% | 315 | $90,356 | 2.7% | 5,505 | $5,170 | 5.6% |
| 2015 | $38,462,050 | 35.1% | 410 | $93,810 | 3.8% | 7,243 | $5,310 | 2.7% |
| 2016 | $48,462,050 | 26.0% | 652 | $74,328 | -20.8% | 11,296 | $4,290 | -19.2% |
| 2017 | $64,462,050 | 33.0% | 816 | $78,998 | 6.3% | 14,032 | $4,594 | 7.1% |
| 2018 | $77,462,050 | 20.2% | 938 | $82,582 | 4.5% | 16,051 | $4,826 | 5.1% |
| 2019 | $95,962,050 | 23.9% | 1,045 | $91,830 | 11.2% | 18,756 | $5,116 | 6.0% |
| 2020 | $122,798,645 | 28.0% | 1,203 | $102,077 | 11.2% | 20,439 | $6,008 | 17.4% |
| 2021 | $126,798,645 | 3.3% | 1,248 | $101,601 | -0.5% | 18,906 | $6,707 | 11.6% |
| 2022 | $151,245,222 | 19.3% | 1,396 | $108,342 | 6.6% | 21,939 | $6,894 | 2.8% |
| 2023 | $173,745,222 | 14.9% | 1,462 | $118,841 | 9.7% | 23,388 | $7,429 | 7.8% |
| 2024 | $181,550,866 | 4.5% | 1,531 | $118,583 | -0.2% | 24,640 | $7,368 | -0.8% |
| AVERAGE | $64,128,261 | 25.9% | 648 | $91,115 | 2.9% | 10,814 | $5,315 | 3.6% |
With the success and growth of the FCPK program, many in the state have now turned their attention to expanding the program to include three-year-olds.⁴² However, assuming enrollment trends for a new FCPK-3 program followed the pattern seen among four-year-olds, the state would need to appropriate an estimated more than $138 million total to fund the program at its full 44 percent uptake with additional appropriations able to meet an estimated 22 percent growth over its first decade of implementation if funded at a similar rate to the average $5,315 per enrollee seen in the FCPK program’s history.⁴³
Florida
Florida’s Voluntary Pre-K (FVPK) was established by a constitutional amendment in 2002 to provide prekindergarten access for all four-year-olds regardless of family income level. The FVPK program, fully operational beginning in 2005, features two tracks: a 540–hour school-year program and a 300-hour summer program. The majority of the state’s four-year-olds attend VPK at a licensed private childcare center—more than 68 percent—with sizeable portions attending pre-k at a public or private school—21.5 percent and 6.4 percent, respectively—with the remaining small numbers of students attending an unlicensed private home-based center, special education program, or other license-exempt program.⁴⁴
Managed by the state Department of Education’s Division of Early Learning, regional early learning coalitions monitor programs for compliance and administer VPK. They distribute funding based on county-level full-time equivalents and consider a fixed hourly reimbursement rate based on market factors. Additionally, if providers exceed prior-year performance indicators, they can receive supplement recognition funds pending legislative appropriations.⁴⁵
As part of its process to inform the Legislature of trends in provider care costs and reimbursement rates before the start of the budget process, the Division of Early Learning provides a market rate report to the Legislature on or before November 1 of each year. The report and findings of the division are used to determine what changes, if any, may need to be made to the state’s reimbursement rates for its ECE programs. The report must provide the:
- Current fiscal year’s reimbursement rates by county, provider type, care level, and units of care—i.e., full or part-time;
- Average salaries for child care instructors and directors as gathered by the state Department of Commerce’s Bureau of Workforce Statistics and Economic Research;
- Average annual costs of instructional materials, curriculum, regulatory fees, personnel costs, and other operational costs per child incurred by providers;
- Market Rate Survey data for the current and prior years; and
- Details on base, mid-level, and high-quality care costs for the typical provider.⁴⁶
State administrative code further breaks down the formula for the distribution of monthly and total VPK payments owed to providers, as a county’s allocation per full-time equivalent student divided by the number of program hours—540 for a full school year program or 300 for a summer-only program—multiplied by the lesser of the hours a student is enrolled for the month or a student’s number of hours attending a program divided by 0.8. The total payment owed to a provider is calculated based upon this monthly formula compared to the actual year-end data for attendance and enrollment, with opportunities for providers to be paid any reconciliated amount or for the state to claw back any overpayments.⁴⁷
TABLE 7. Historic Enrollment and Funding Trends in Florida’s VPK Program
| Year | FL VPK Nominal Funding | FL VPK Funding YoY | FL VPK Enrollment | FL VPK Enrollment YoY | FL VPK Per Student | FL VPK Per Student YoY |
|---|---|---|---|---|---|---|
| 2006 | $229,100,000 | – | 105,896 | – | $2,163 | – |
| 2007 | $290,406,902 | 26.8% | 124,390 | 17.5% | $2,335 | 7.3% |
| 2008 | $336,469,116 | 15.9% | 134,583 | 8.2% | $2,500 | 6.6% |
| 2009 | $361,764,938 | 7.5% | 147,762 | 9.8% | $2,448 | -2.1% |
| 2010 | $391,819,943 | 8.3% | 155,877 | 5.5% | $2,514 | 2.6% |
| 2011 | $398,200,356 | 1.6% | 164,388 | 5.5% | $2,422 | -3.8% |
| 2012 | $399,463,552 | 0.3% | 175,122 | 6.5% | $2,281 | -6.2% |
| 2013 | $390,360,150 | -2.3% | 174,145 | -0.6% | $2,242 | -1.8% |
| 2014 | $381,108,517 | -2.4% | 170,266 | -2.2% | $2,238 | -0.1% |
| 2015 | $383,703,444 | 0.7% | 166,522 | -2.2% | $2,304 | 2.9% |
| 2016 | $397,685,494 | 3.6% | 169,025 | 1.5% | $2,353 | 2.1% |
| 2017 | $397,698,606 | 0.0% | 174,252 | 3.1% | $2,282 | -3.1% |
| 2018 | $379,969,502 | -4.5% | 174,574 | 0.2% | $2,177 | -4.9% |
| 2019 | $391,215,901 | 3.0% | 173,633 | -0.5% | $2,253 | 3.4% |
| 2020 | $400,277,729 | 2.3% | 166,726 | -4.0% | $2,401 | 6.2% |
| 2021 | $302,505,878 | -24.4% | 136,142 | -18.3% | $2,222 | -8.0% |
| 2022 | $354,904,063 | 17.3% | 157,451 | 15.7% | $2,254 | 1.4% |
| 2023 | $489,183,355 | 37.8% | 155,668 | -1.1% | $3,142 | 28.3% |
| 2024 | $433,804,469 | -11.3% | 152,877 | -1.8% | $2,838 | -10.7% |
| AVERAGE | $374,191,680 | 4.5% | 156,805 | 2.4% | $2,388 | 1.1% |
The New Worlds Reading Initiative Supporting Pre-K Reading
In 2021, lawmakers passed Florida House Bill 3 (2021)—establishing the New Worlds Reading Initiative, a home book delivery program for kindergarten through fifth grade students, initially, who are reading below grade level. Lawmakers appropriated $200 million in start-up costs to fund the initial administration and implementation of the program, with recurring support via select tax credits.⁵⁰
Specifically, corporate taxpayers donating funds to the initiative may receive a dollar-for-dollar credit against tax liabilities for:
- Corporate income taxes;
- Insurance premium taxes;
- Severance taxes on oil and gas production;
- Alcoholic beverage excise taxes on beer, wine, and spirits; or
- Direct pay sales and use tax permit holders.
The credit was initially capped at $10 million before increasing annually to $30 million, then $50 million over three years. House Bill 7071 (2022) expanded this tax credit cap to $60 million, up from $50 million, starting in Fiscal Year 2024 and beyond.⁵¹
However, it was not until the passage of House Bill 7039 (2023) that the program was expanded to add “prekindergarten” among the eligible grades. Prekindergartners can receive a free book and activity each month of the school year, delivered to the student’s home to strengthen their literacy skills, build reading confidence, and foster a lifelong love of reading.⁵²
Additionally, those students in VPK who exhibit a substantial delay in early literacy or mathematics skills based on the coordinated screening and progress monitoring assessment are eligible for New Worlds Scholarship Accounts, worth $1,200 each, to be used to purchase instructional materials, curriculum, part-time tutoring, summer, and after-school programs designed to improve literacy or mathematics skills.⁵³
Georgia
In 1992, Peach State voters approved the Georgia Lottery for Education as supplemental revenues to support public education in the state, specifically access to prekindergarten programs, with the passage of Amendment 1.⁵⁴ In 1995, the program was opened universally to all eligible four–year–olds through an addition to the state’s Lottery for Education budget in House Bill 201.⁵⁵ The following year, lawmakers enacted Senate Bill 709 (1996) to create the Office of School Readiness as the state department responsible for overseeing and administering the pre-k program.⁵⁶ On July 1, 2004, the Office of School Readiness officially became Bright from the Start: Georgia Department of Early Care and Learning (DECAL), one of the first such departments in the U.S. designed to shift the discussion surrounding ECE to an education-based mission versus a childcare or babysitting focus.⁵⁷,⁵⁸
As a strictly lottery-funded program—excepting its first-year pilot in 1992, which featured direct appropriations from the state’s General Fund—Georgia’s prekindergarten program has not seen the number of funded slots increase in over a decade since its post-Great Recession recovery.⁵⁹ Funds are disbursed by grants to eligible public and private educational entities—including schools, childcare centers, Head Start facilities, and licensed for-profit or nonprofit entities. Grants may be used for personnel costs, including teacher and staff salaries and benefits; instructional materials; equipment; transportation; and personal development costs for staff.⁶⁰
TABLE 8. Comparison of Georgia’s Historic Trends in Pre-K Enrollment and Funding
| Year | Nominal Funding | YoY Change | Funded Slots | YoY Change | Students Served | YoY Change | % of Funded Slots Filled | Cost per Funded Slot | Cost per Funded Slot YoY Change | Cost per Child Served | Cost per Child Served YoY Change |
|---|---|---|---|---|---|---|---|---|---|---|---|
| 1992 | $3,000,000§ | – | 750 | – | – | – | – | – | – | $4,000 | – |
| 1993 | $37,000,000 | 1133.3% | 8,700 | 1060.0% | – | – | – | – | – | $4,253 | 6.3% |
| 1994 | $78,000,000 | 110.8% | 15,500 | 78.2% | – | – | – | – | – | $5,032 | 18.3% |
| 1995 | $182,000,000 | 133.3% | 44,000 | 183.9% | – | – | – | – | – | $4,136 | -17.8% |
| 1996 | $205,000,000 | 12.6% | 57,000 | 29.5% | – | – | – | – | – | $3,596 | -13.1% |
| 1997 | $210,000,000 | 2.4% | 60,000 | 5.3% | – | – | – | – | – | $3,500 | -2.7% |
| 1998 | $216,000,000 | 2.9% | 61,000 | 1.7% | – | – | – | – | – | $3,540 | 1.1% |
| 1999 | $225,000,000 | 4.2% | 62,000 | 1.6% | – | – | – | – | – | $3,629 | 2.5% |
| 2000 | $229,000,000 | 1.8% | 62,500 | 0.8% | – | – | – | – | – | $3,664 | 1.0% |
| 2001 | $237,000,000 | 3.5% | 63,500 | 1.6% | – | – | – | – | – | $3,732 | 1.9% |
| 2002 | $253,000,000 | 6.8% | 65,900 | 3.8% | – | – | – | – | – | $3,839 | 2.9% |
| 2003** | $236,700,000 | -6.4% | 68,200 | 3.5% | 63,613 | – | 93.3% | $3,471 | – | $3,721 | -3.1% |
| 2004 | $252,000,000 | 6.5% | 72,000 | 5.6% | 65,900 | 3.6% | 91.5% | $3,500 | 0.8% | $3,824 | 2.8% |
| 2005 | $276,000,000 | 9.5% | 74,000 | 2.8% | 70,793 | 7.4% | 95.7% | $3,730 | 6.6% | $3,899 | 2.0% |
| 2006 | $289,894,973 | 5.0% | 76,600 | 3.5% | 72,902 | 3.0% | 95.2% | $3,785 | 1.5% | $3,977 | 2.0% |
| 2007 | $309,579,333 | 6.8% | 78,000 | 1.8% | 75,299 | 3.3% | 96.5% | $3,969 | 4.9% | $4,111 | 3.4% |
| 2008 | $325,000,000 | 5.0% | 79,000 | 1.3% | 76,491 | 1.6% | 96.8% | $4,114 | 3.7% | $4,249 | 3.3% |
| 2009 | $331,542,255 | 2.0% | 82,000 | 3.8% | 78,310 | 2.4% | 95.5% | $4,043 | -1.7% | $4,234 | -0.4% |
| 2010 | $341,470,922 | 3.0% | 84,000 | 2.4% | 81,177 | 3.7% | 96.6% | $4,065 | 0.5% | $4,206 | -0.6% |
| 2011 | $355,016,016 | 4.0% | 86,000 | 2.4% | 82,608 | 1.8% | 96.1% | $4,128 | 1.5% | $4,298 | 2.2% |
| 2012 | $289,222,657 | -18.5% | 84,000 | † | 82,868 | 0.3% | 98.7% | $3,443 | -16.6% | $3,490 | -18.8% |
| 2013 | $293,939,678 | 1.6% | 84,000 | 0.0% | 81,683 | -1.4% | 97.2% | $3,499 | 1.6% | $3,599 | 3.1% |
| 2014 | $305,084,448 | 3.8% | 84,000 | 0.0% | 81,453 | -0.3% | 97.0% | $3,632 | 3.8% | $3,746 | 4.1% |
| 2015 | $312,053,998 | 2.3% | 84,000 | 0.0% | 80,430 | -1.3% | 95.8% | $3,715 | 2.3% | $3,880 | 3.6% |
| 2016 | $314,460,869 | 0.8% | 84,000 | 0.0% | 80,825 | 0.5% | 96.2% | $3,744 | 0.8% | $3,891 | 0.3% |
| 2017 | $348,959,814 | 11.0% | 84,000 | 0.0% | 80,874 | 0.1% | 96.3% | $4,154 | 11.0% | $4,315 | 10.9% |
| 2018 | $355,281,106 | 1.8% | 84,000 | 0.0% | 80,536 | -0.4% | 95.9% | $4,230 | 1.8% | $4,411 | 2.2% |
| 2019 | $365,326,841 | 2.8% | 84,000 | 0.0% | 80,493 | -0.1% | 95.8% | $4,349 | 2.8% | $4,539 | 2.9% |
| 2020 | $377,031,052 | 3.2% | 84,000 | 0.0% | 80,328 | -0.2% | 95.6% | $4,488 | 3.2% | $4,694 | 3.4% |
| 2021 | $361,514,563 | -4.1% | 84,000 | 0.0% | 66,554 | -17.1% | 79.2% | $4,304 | -4.1% | $5,432 | 15.7% |
| 2022 | $386,946,908 | 7.0% | 84,000 | 0.0% | 73,177 | 10.0% | 87.1% | $4,607 | 7.0% | $5,288 | -2.7% |
| 2023 | $414,786,468 | 7.2% | 84,000 | 0.0% | 73,462 | 0.4% | 87.5% | $4,938 | 7.2% | $5,646 | 6.8% |
| 2024 | $457,779,908 | 10.4% | 84,000 | 0.0% | 71,526 | -2.6% | 85.2% | $5,450 | 10.4% | $6,400 | 13.4% |
| AVERAGE | $278,017,934 | 46.1% | 69,474 | 43.5% | 76,423 | 0.7% | 93.8% | $4,062 | 2.3% | $4,205 | 1.8% |
§Funding in 1992 came exclusively from the state’s General Fund and non-lottery sources.
**The limited data preceding 2003 came from the Georgia DECAL archives.
† † Since bounding back from a brief ‘Great Recession’ downturn, the reported number of funded slots has remained flat at 84,000 for more than a decade per Georgia DECAL.
During the 2025 legislative session, lawmakers considered a measure to amend the state constitutional prohibition on gambling to allow for sports betting in the state. Online betting service providers and licensees would be levied a 24 percent privilege tax on adjusted gross revenues.⁶³ Eighty-five percent of the first $150 million in tax receipts, as well as all monies received over $150 million, are dedicated to Article I, Section II, Paragraph VIII programs—namely, Georgia’s prekindergarten and postsecondary scholarship programs.⁶⁴,⁶⁵
Oklahoma
Living up to its reputation as the Sooner State, Oklahoma was one of the first states—alongside the aforementioned Georgia—to provide universal pre-k for all four-year-olds across every school district. While its initial Early Childhood Four-Year-Old Program began in 1980, it was not until 1998 that the program became universal, with 100 percent of school districts providing non-income-based prekindergarten for four-year-olds.⁶⁶
However, as a middle step—which other states yet to create widespread or universal-type programs may wish to consider—the state, in 1990, allowed for local school districts to use local funds and other sources of money to offer prekindergarten for all four-year-olds if they chose to. This flexibility led to widespread utilization and demand enough for lawmakers to fund universal pre-k at the state level subsequently.⁶⁷
In 1998, lawmakers enacted House Bill 1657, which amended a clause in the state’s statutory right to a free public education to entitle children aged four the right to attend half- or full-day ECE programs at any public school in the state offering such programs—but did not make pre-k participation mandatory. The new language also noted that pre-k students are counted in a district’s average daily membership—or ADM for the state aid calculation. Likewise, if a local district does not offer prekindergarten, families could transfer their child into another district offering and having space for the child in their ECE program, with the student’s ADM counting towards the receiving district’s funding formula.⁶⁸
TABLE 9. Historic Trends in Oklahoma’s Pre-K Enrollment and Funding
| Year | Nominal State Funding | YoY Change | Students Enrolled | YoY Change | Per Student Estimate | YoY Change |
|---|---|---|---|---|---|---|
| 2003 | $62,828,834 | – | 25,879 | – | $2,428 | – |
| 2004 | $66,439,166 | 5.7% | 28,060 | 8.4% | $2,368 | -2.5% |
| 2005 | $79,818,197 | 20.1% | 31,712 | 13.0% | $2,517 | 6.3% |
| 2006 | $112,352,971 | 40.8% | 33,402 | 5.3% | $3,364 | 33.6% |
| 2007 | $118,006,070 | 5.0% | 34,375 | 2.9% | $3,433 | 2.1% |
| 2008 | $139,735,129 | 18.4% | 35,231 | 2.5% | $3,966 | 15.5% |
| 2009 | $147,185,345 | 5.3% | 36,042 | 2.3% | $4,084 | 3.0% |
| 2010 | $167,245,396 | 13.6% | 37,356 | 3.6% | $4,477 | 9.6% |
| 2011 | $133,029,544 | -20.5% | 38,441 | 2.9% | $3,461 | -22.7% |
| 2012 | $146,406,556 | 10.1% | 40,089 | 4.3% | $3,652 | 5.5% |
| 2013 | $144,859,409 | -1.1% | 40,114 | 0.1% | $3,611 | -1.1% |
| 2014 | $149,859,677 | 3.5% | 40,823 | 1.8% | $3,671 | 1.7% |
| 2015 | $148,690,138 | -0.8% | 40,085 | -1.8% | $3,709 | 1.0% |
| 2016 | $143,368,061 | -3.6% | 41,241 | 2.9% | $3,476 | -6.3% |
| 2017 | $144,470,607 | 0.8% | 41,264 | 0.1% | $3,501 | 0.7% |
| 2018 | $145,038,018 | 0.4% | 39,807 | -3.5% | $3,644 | 4.1% |
| 2019 | $181,685,479 | 25.3% | 42,606 | 7.0% | $4,264 | 17.0% |
| 2020 | $196,744,743 | 8.3% | 42,683 | 0.2% | $4,609 | 8.1% |
| 2021 | $178,522,508 | -9.3% | 38,450 | -9.9% | $4,643 | 0.7% |
| 2022 | $184,734,990 | 3.5% | 39,240 | 2.1% | $4,708 | 1.4% |
| 2023 | $187,024,576 | 1.2% | 38,982 | -0.7% | $4,798 | 1.9% |
| 2024 | $197,385,755 | 5.5% | 38,457 | -1.3% | $5,133 | 7.0% |
| AVERAGE | $144,337,780 | 6.3% | 37,470 | 2.0% | $3,796 | 4.1% |
More uniquely among most states, Oklahoma is one of only six nationally, including West Virginia in the South, to fund its prekindergarten programs through its statewide student-based funding formula. Specifically, half-day prekindergarten students are counted at a grade level weight of 0.7, while full-timers are calculated at 1.3. Additionally, children in pre-k are eligible for the additional weights for special educational needs or disabilities, economic disadvantage, and English language learners.⁷⁰
What could the possible cost be for other states in the South if a similar weighted model to Oklahoma’s were implemented? The equation and table below estimate what a rough per-pupil and total cost to the state the inclusion of a weighted pre-k count to the state’s existing funding formula could incur using the Sooner State’s multiplicative model as compared to an additive model—such as that used for special education funding—where the base funding amount is multiplied by the weight. The general formula used to calculate the estimated weighted per-pupil funding amount for other states based on Oklahoma’s model is:
=State Base Funding × (0.7 or 1.3)
More specifically, using Oklahoma’s 2023 report, an estimated 67 percent of four-year-olds are enrolled in pre-k, and of these, approximately 7.1 percent are in the half-day and 90 percent are in the full-day programs, providing the following final equation in Table 10.⁷¹
Assuming states decide to implement a weighted-funding model similar to the Oklahoma Early Four-Year-Old Program with similar levels of uptake and funding equivalent to the 2023 level, states in the South would need to allocate approximately $4,258 per pupil for half-day and $7,908 per pupil for full-school-day prekindergarten programs, which could cost between $100 million to more than $1 billion depending upon enrollment numbers, types of program, and the weights assigned to these young learners. These projections assume enrollment patterns and grade-level weighting consistent with Oklahoma’s 2023 model and do not account for state-specific variations in base funding formulas or cost structures.
TABLE 10. Estimating CSG South Pre-K Funding Formula Costs Using Oklahoma’s Per Pupil Weights (2023) † †
| State | Total Number of Four-Year-Olds | Estimated Total Pre-K Enrollment §§ | Estimated Pre-K Enrollment (Half-Day) | Estimated Base Cost Per Pupil (Half-Day) | Estimated Total Base Cost (Half-Day) | Estimated Pre-K Enrollment (School Day) | Estimated Base Cost Per Pupil (School Day) | Estimated Total Base Cost (School Day) |
|---|---|---|---|---|---|---|---|---|
| Alabama | 59,779 | 38,856 | 2,759 | $5,151 | $14,209,480 | 34,971 | $9,565 | $334,508,877 |
| Arkansas | 37,179 | 24,166 | 1,716 | $5,333 | $9,149,733 | 21,750 | $9,903 | $215,396,128 |
| Florida | 231,285 | 150,335 | 10,674 | $3,598 | $38,402,325 | 135,302 | $6,682 | $904,038,636 |
| Georgia | 131,003 | 85,152 | 6,046 | $2,116 | $12,791,250 | 76,637 | $3,929 | $301,121,981 |
| Kentucky | 54,165 | 35,207 | 2,500 | $2,940 | $7,349,161 | 31,687 | $5,460 | $173,008,427 |
| Louisiana | 56,413 | 36,668 | 2,603 | $2,811 | $7,317,024 | 33,002 | $5,220 | $172,251,877 |
| Mississippi | 35,394 | 23,006 | 1,633 | $4,731 | $7,728,262 | 20,705 | $8,787 | $181,932,929 |
| Missouri | 73,138 | 47,540 | 3,375 | $4,463 | $15,062,360 | 42,786 | $8,288 | $354,586,737 |
| North Carolina | 122,070 | 79,346 | 5,634 | $4,744 | $26,724,905 | 71,411 | $8,810 | $629,137,611 |
| South Carolina | 59,366 | 38,588 | 2,740 | $4,818 | $13,200,346 | 34,729 | $8,948 | $310,752,603 |
| Tennessee | 83,834 | 54,492 | 3,869 | $4,802 | $18,578,646 | 49,043 | $8,918 | $437,364,493 |
| Texas | 393,253 | 255,614 | 18,149 | $4,312 | $78,256,875 | 230,053 | $8,008 | $1,842,264,464 |
| Virginia | 100,661 | 65,430 | 4,646 | $4,520 | $20,997,219 | 58,887 | $8,394 | $494,300,723 |
| West Virginia | 17,923 | 11,650 | 827 | $5,281 | $4,367,995 | 10,485 | $9,807 | $102,828,051 |
| AVERAGE | 103,962 | 67,575 | 4,798 | $4,258 | $19,581,113 | 60,818 | $7,908 | $460,963,824 |
† †Oklahoma’s grade-level weights are multiplicative, meaning each student’s enrollment is first multiplied by a grade-level weight to reflect the differing costs of educating students at various stages. As such, the multiplicative model – versus one where the weight is added on to the base amount, as is
seen for special education, etc. – is used throughout these estimates.
§ §Approximately 2.9 percent of Oklahoma Four-Year-Old’s are enrolled in a local school, district, or other program that does not qualify for full or half-day counts, so calculations will not equal 100 percent of estimated enrollment for other states in this model.
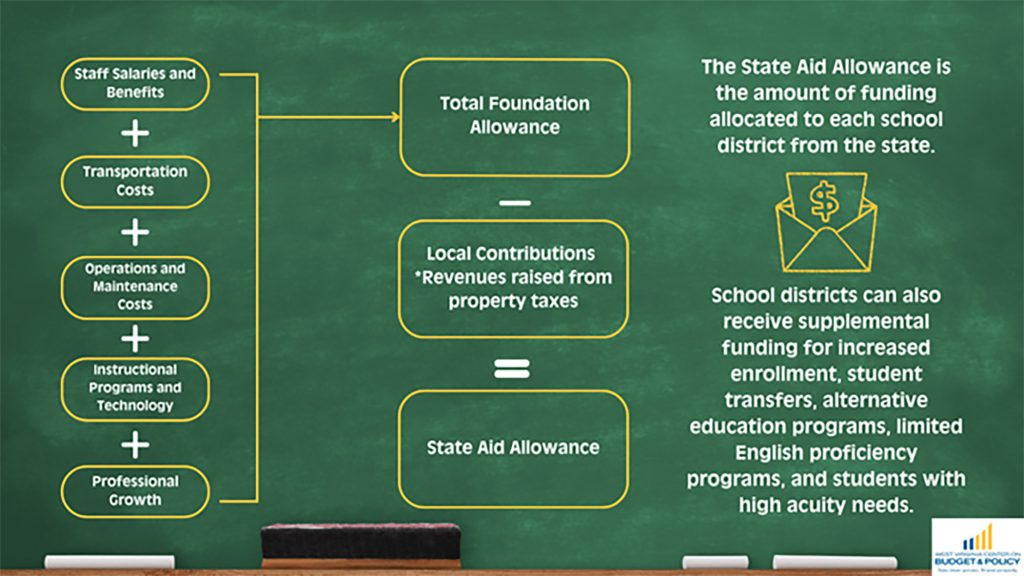
West Virginia
In 1983, lawmakers passed House Bill 1760 to create a Public School Early Childhood Education program, which allowed local public school districts to offer three- and four-year preschool voluntarily utilizing existing funds.⁷⁴ However, lawmakers did not enact a measure requiring prekindergarten to be available to four-year-olds until 2002 with Senate Bill 728, which required every local district to provide ECE to all four-year-olds by 2012. Enrollment remained voluntary, and collaborative partnerships with other providers—including Head Start—would allow districts to satisfy the requirement.⁷⁵
Like Oklahoma, West Virginia uniquely funds its universal pre-k funding within its existing state K–12 resource-based funding formula. Allocated directly to public schools through its Public School Support Program (PSSP) formula, these schools can partner with childcare centers, private providers, or Head Start agencies.
TABLE 11. Historical Enrollment and Funding Trends in West Virginia’s Pre-K Program
| Year | State Pre-K Enrollment | YoY Change | Nominal State Pre-K Funding | YoY Change | Per Pupil Amount | YoY Change |
|---|---|---|---|---|---|---|
| 2003 | 6,853 | – | $17,037,219 | – | $2,486 | – |
| 2004 | 7,727 | 12.8% | $25,571,000 | 50.1% | $3,309 | 33.1% |
| 2005 | 7,980 | 3.3% | $34,500,000 | 34.9% | $4,323 | 30.6% |
| 2006 | 8,944 | 12.1% | $40,511,010 | 17.4% | $4,529 | 4.8% |
| 2007 | 10,659 | 19.2% | $47,338,791 | 16.9% | $4,441 | -1.9% |
| 2008 | 12,404 | 16.4% | $59,452,747 | 25.6% | $4,793 | 7.9% |
| 2009 | 13,135 | 5.9% | $69,147,853 | 16.3% | $5,264 | 9.8% |
| 2010 | 13,878 | 5.7% | $76,617,241 | 10.8% | $5,521 | 4.9% |
| 2011 | 14,647 | 5.5% | $82,100,333 | 7.2% | $5,605 | 1.5% |
| 2012 | 15,268 | 4.2% | $91,644,229 | 11.6% | $6,002 | 7.1% |
| 2013 | 15,770 | 3.3% | $92,946,182 | 1.4% | $5,894 | -1.8% |
| 2014 | 16,834 | 6.7% | $97,069,726 | 4.4% | $5,766 | -2.2% |
| 2015 | 16,622 | -1.3% | $98,051,203 | 1.0% | $5,899 | 2.3% |
| 2016 | 16,387 | -1.4% | $97,807,662 | -0.2% | $5,969 | 1.2% |
| 2017 | 16,300 | -0.5% | $98,007,376 | 0.2% | $6,013 | 0.7% |
| 2018 | 15,101 | -7.4% | $98,278,800 | 0.3% | $6,508 | 8.2% |
| 2019 | 13,534 | -10.4% | $99,009,024 | 0.7% | $7,316 | 12.4% |
| 2020 | 15,142 | 11.9% | $96,812,321 | -2.2% | $6,394 | -12.6% |
| 2021 | 11,981 | -20.9% | $108,979,846 | 12.6% | $9,096 | 42.3% |
| 2022 | 13,268 | 10.7% | $86,922,185 | -20.2% | $6,551 | -28.0% |
| 2023 | 13,731 | 3.5% | $96,845,695 | 11.4% | $7,053 | 7.7% |
| 2024 | 13,864 | 1.0% | $109,570,771 | 13.1% | $7,903 | 12.1% |
| AVERAGE | 13,183 | 3.8% | $78,373,692 | 10.2% | $5,756 | 6.7% |
Specifically, State Board of Education Rule 2525 requires every local school board to enroll children participating in the voluntary pre-k in community classrooms to generate funding through the existing PSSP formula while also ensuring that boards utilize all available federal funds—such as Head Start—and partner with a collaborative community provider, where feasible, to offer these pre-k services at no cost to families.⁷⁷
Similar to other grade levels, the PSSP Foundation Formula sets an allowance for staff and instructional personnel based on the role and population of the area to determine the staffing ratio. The resource- and staffing-based model makes state-to-state comparisons difficult, given the emphasis on county density and calculations based on allowances for professional educators, noninstructional staff, transportation, and more, all based on total county FTE—not just early learning program enrollment.⁷⁸
FIGURE 6. The Public School Support Program Formula in West Virginia
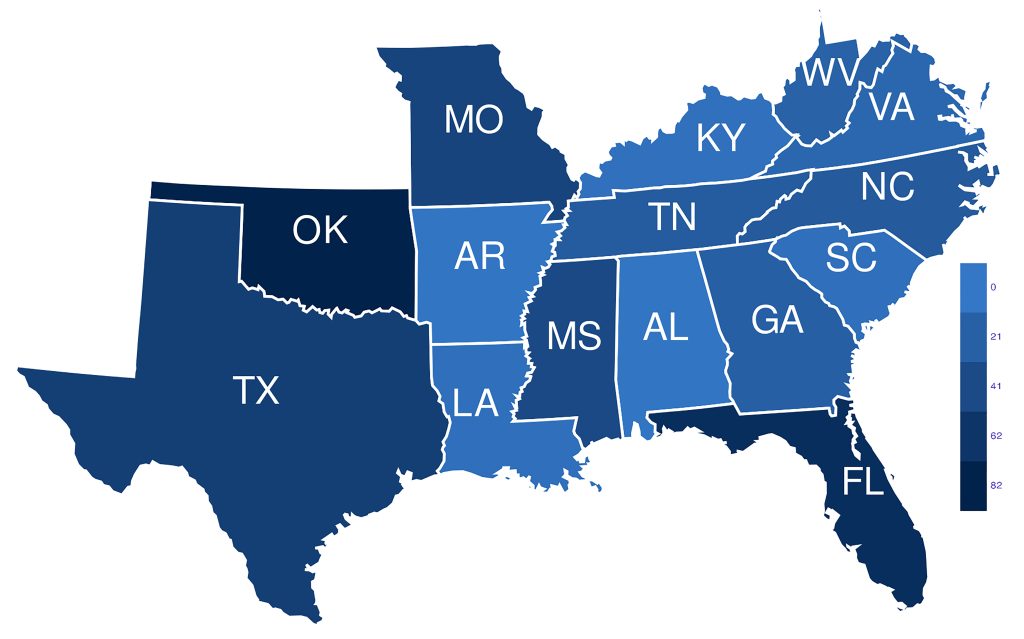
Recent Legislative Trends in Other Southern States
Since 2020, more than 400 pieces of legislation seeking to implement or expand funding for early learning prekindergarten opportunities in the South have been filed—but only 7 percent, or 32, of such bills were signed into law. However, this trend looks to continue, and many of the proposals highlighted below are sure to come up for debate again in 2026 and beyond.
FIGURE 7. Southern State Legislative Proposals Addressing Pre-K Funding Since 2020
Louisiana
A proposal to expand the existing online sports betting tax to support early childhood education in Louisiana died in committee in 2025. The state already levied a 15 percent tax on electronic sports betting, but this measure would have added a 10 percent levy on the net gaming proceeds from in-person sports wagering. It also would have increased the amount of tax receipts received from sports betting at casinos dedicated to the state’s ECE fund to 40 percent, up from 25 percent, and raise the cap on receipts to $30 million from $20 million.⁸⁰
Mississippi
Lawmakers in the Magnolia State attempted to pass legislation creating a universal prekindergarten program during the 2025 legislative session, but it failed to make it out of committee. The proposal would have mandated a minimum of 10 hours per week for 35 weeks of publicly funded pre-k to be available to any interested family with a four-year-old. Families would have the option to enroll in a private provider—with the local school district paying tuition on behalf of the child via state funds—or a school district-based program. The state Department of Education and Division of Early Learning would be responsible for setting a statewide reimbursement rate for pre-k providers, subject to annual review and legislative appropriations. Initially, $8 million would be appropriated to establish the program before increasing to $16 million the next year and $33.95 million each year thereafter.⁸¹
South Carolina
During the 2025 legislative session, South Carolina legislators debated a measure to establish a universal Head Start and Early Start state program. The proposal would have directed the state’s Office of First Steps to School Readiness to begin a five-year program to expand the state’s existing Head Start and Early Head Start programs to be universally accessible and funded. The office would be directed to identify state, private, and other public funding sources and needs that would be necessary to expand the federally funded Head Start programs to every child in the state. While much discretion would be left to the office to request funds or reach the full universal reach of the program, the legislation does require that the plan ensure that program expansion increases by at least 20 percent annually.⁸²
Tennessee
A bipartisan proposal in 2025 failed to make it out of committee that would have created a universal pre-k fund in the Volunteer State. As proposed, the bill would have established a voluntary pre-k program for all four-year-old’s in the state and required each local school district to offer such a program. Funded by a new 9.5 percent tax on digital advertising services for companies with gross revenues exceeding $50 million annually, the fund would solely support universal pre-k, with the state funding 100 percent of the costs associated with offering these preschool programs—subject to appropriations.⁸³ According to a fiscal note prepared alongside the bill, it is estimated that such a proposal would cost more than $1.7 million in initial start-up administrative costs before considering a recurring annual estimated cost of more than $382 million each year going forward. For reference, the state’s current voluntary, limited pre-k program is appropriated at $86 million a year so this would be an annual increase of more than 344 percent.⁸⁴
Texas
During the 2025 session, lawmakers filed a proposal—which died in committee—to add prekindergarten programs to the state’s Foundation School Program, its student-based funding formula. As detailed, the measure would have added an annual weighted allotment of 0.2 for each student enrolled in a prekindergarten class through a local school district partnership with a community-based childcare provider. However, it would cap the total number of students eligible for this weighted funding at 10,000 per district per year. The proposal was designed to encourage district collaboration with community partners to ensure pre-k classroom seats are available to any interested student, regardless of whether the district had the capacity to offer such a program itself.⁸⁵
Another measure in 2025, which failed to garner a hearing in committee, would have established a state prekindergarten fund to expand access to high-quality pre-k for eligible low-income, rural, and underserved communities. The proposal did not specify funding disbursement or revenue sources, but would appear to be a fund requiring recurring legislative appropriations to fund.⁸⁶
Virginia
Lawmakers in the Commonwealth filed a bill that would have created a new Early Childhood Care and Education Fund to support early learning for families. The measure would have created a funding formula for early learning that was based on the minimum funding and number of slots per biennium, based on a cost of quality rate per child, actual data from the prior year, unserved waitlists, and a multiplier based on enrollment and parent demand growth in the prior biennium.⁸⁷ With the aim of reducing or eliminating waiting lists and increasing access to early learning programs, including prekindergarten, the state Department of Planning and Budget estimated the program would require an additional $7.9 million to eliminate wait lists for existing programs. In comparison, it would cost more than $110.5 million to fully eliminate waitlists, provide universal access, and continue to accommodate existing enrollment. However, as the bill also would have established new higher-quality provider standards and continuous cost of quality adjustments—which include increased training and support as well as economic indicators—the total estimated funding would have exceeded $326.4 million based on estimates.⁸⁸
Conclusion
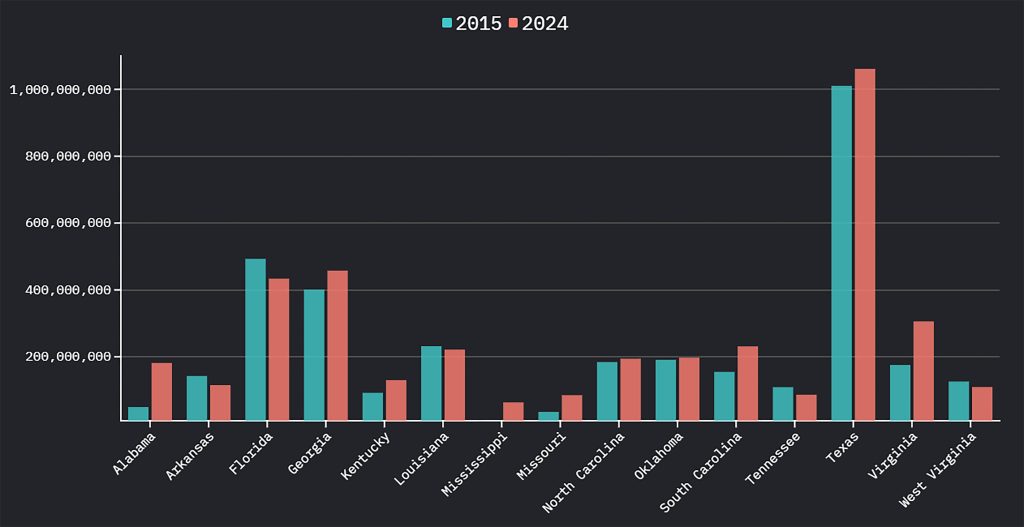
When accounting for “real” or inflation-adjusted dollars, states in the South are yet to fully return to the levels of pre-kindergarten funding that existed pre-Great Recession in 2010. As the figure illustrates, state funding since 2002 has remained relatively flat—with brief dips during times of economic uncertainty—with recent spending increasing to near peak levels. As a region, since 2015, total state spending on pre-k has increased by approximately 13.8 percent, but levels among states vary greatly. Over the same decade, five states in the South—Arkansas, Florida, Louisiana, Tennessee, and West Virginia—have all seen a decline in total real spending on preschool. The largest growth was among states that expanded their programs—such as Alabama’s universal eligibility program, which realized a more than 265 percent growth, and Mississippi, which started its partial program in 2015 and saw spending quickly rise from $8 million in its first year to more than $63.5 million in 2024.⁸⁹
Given the variability of state funding, the specter of changes in federal dollars may loom large over future pre-k expansion decisions. Federal education appropriations for FY 2026 maintained most programs at existing levels; however, longer-term federal budget trajectories remain subject to congressional action. In the interim, the levers that state policymakers control can be used to make a strong investment in early childhood education, as seen in states such as Alabama, Georgia, and Oklahoma, which have maintained steadily increasing funding since 2015 and have seen enrollment increase across every school district in the state.⁹² As research shows, families who receive childcare and early education supports, or have access to such programs, report markedly improved long-term economic and social outcomes.⁹³
FIGURE 8. Inflation-Adjusted State Pre-K Spending Trends (2002-2024)
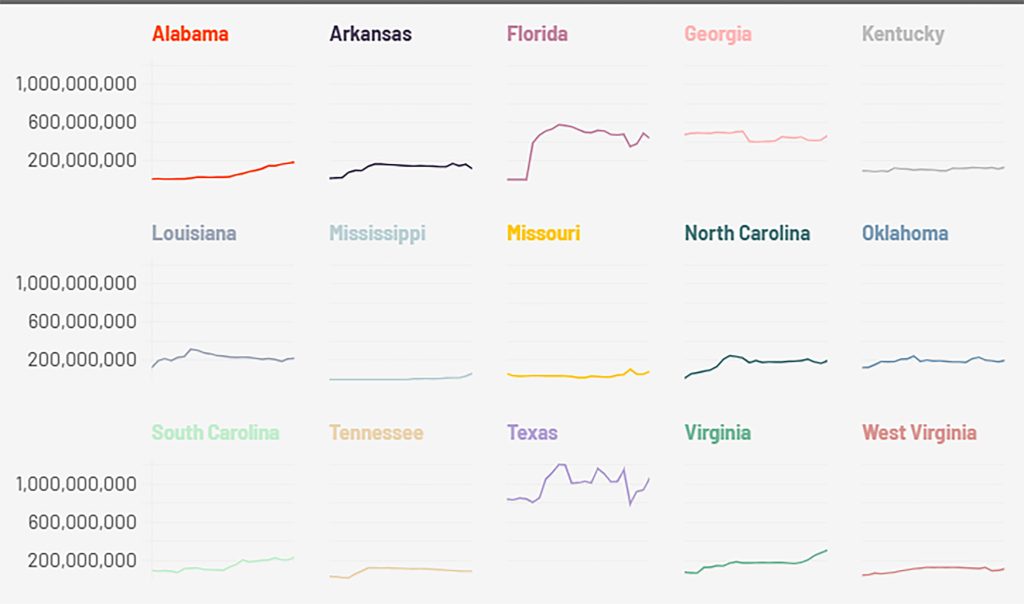
FIGURE 9. Comparison of Inflation-Adjusted State Pre-K Spending in 2015 and 2024
However, as the trends in per-student spending illustrate, these programs—like many—have historically been susceptible to budget downturns, which, in turn, significantly impact access to and enrollment in these pre-k programs. Lawmakers may wish to ensure stable funding supports are available for these programs regardless of future economic downturns or changes to federal ECE funding.⁹⁴ Regarding what to do now, state leaders are considering a range of approaches—including those seen in the aforementioned states, where a comprehensive strategy has led to more stable funding mechanisms than those states with purely discretionary funding of voluntary, non-universal, or quasi-universal programs. With Congress maintaining most education funding—including early education programs and Head Start—at existing levels, lawmakers across the country have demonstrated the continuing importance of access to high-quality early education programs to families.⁹⁵
End Notes
- Hannah Guevara, “National Report on Preschool Policies Funds Uneven Progress Across States,” First Five Years Fund, May 23, 2023, https://www.ffyf.org/resources/2023/05/national-report-on-preschool-policies-finds-uneven-progress-across-states.
- Ibid.
- Bonnie O’Keefe, et al., “How Do States Fund Pre-K?” Splitting the Bill, Bellwether Series on Education Finance Equity, Issue No. 20, March 2025, https://files.eric.ed.gov/fulltext/ED674213.pdf.
- Allison Friedman-Krauss, et al., “The State of Preschool 2024: State Preschool Yearbook,” National Institute for Early Education Research, April 2025, https://nieer.org/sites/default/files/2025-04/2024NIEERStateofPreschool-1.pdf.
- Ibid.
- “2025 Child Care and Early Learning State Fact Sheets,” FFYF, 2025, https://www.ffyf.org/2025-state-fact-sheets.
- Friedman-Krauss, et al., “The State of Preschool 2024: State Preschool Yearbook,” NIEER.
- Samantha Durrance, “Pre-K Benefits: 2018 Update,” Southern Regional Education Board, March 2018, https://www.sreb.org/publication/pre-k-benefits-2018-update.
- “Early Literacy is the Gateway to Lifetime Success,” ExcelinEd, 2025, https://earlyliteracymatters.org.
- “ABCs of Federal Early Learning & Child Care Funding Streams,” FFYF, November 2024, https://www.ffyf.org/wp-content/uploads/2024/11/2024-ABCs-of-Federal-Early-Learning-and-Child-Care-Funding-Streams.pdf.
- “2026 Poverty Guidelines: 48 Contiguous States (Excluding Alaska and Hawaii),” Office of the Assistant Secretary for Planning and Evaluation, U.S. Department of Health and Human Services, updated January 2026, https://aspe.hhs.gov/topics/poverty-economic-mobility/poverty-guidelines.
- “Head Start Program Facts: Fiscal Year 2024,” Office of Head Start, Administration for Children and Families, U.S. Department of Health and Human Services, https://headstart.gov/program-data/article/head-start-program-facts-fiscal-year-2024.
- Ibid.
- Ibid.
- Missouri House Bill 1689 (2014), https://archive.house.mo.gov/bill.aspx?bill=HB1689&year=2014&code=R.
- “PK Eligibility for State Aid,” Division of Financial and Administrative Services, School Finance, Missouri Department of Elementary and Secondary Education, July 1, 2023, https://dese.mo.gov/media/pdf/pre-k-eligibility-state-aid.
- “MOQPK-HS Grant Guidance,” Missouri DESE, August 15, 2025, https://dese.mo.gov/media/pdf/moqpk-hs-25-26-grant-guidance.
- Oklahoma Senate Bill 36x (2024)–Sec. 1, Para. 2, https://www.oklegislature.gov/cf_pdf/2023-24%20ENR/SB/SB36X%20ENR.PDF.
- Oklahoma Statutes 70 § 10-105.4, https://oksenate.gov/sites/default/files/2019-12/os70.pdf.
- “Appendices – The State of Preschool 2025,” NIEER, https://nieer.org/sites/default/files/2025-09/2024NIEERStateofPreschool_all.pdf.
- “2024 CCDBG State Fact Sheets,” FFYF, May 29, 2024, https://www.ffyf.org/resources/2024/05/2024-ccdbg-state-fact-sheets.
- Ibid.
- Stephanie Schmit, “CCDBG FY2024 State-by-State Appropriations Distribution Estimates and Increases,” The Center for Law and Social Policy, April 2, 2024, https://www.clasp.org/publications/fact-sheet/ccdbg-fy2024-state-by-state-appropriations-distribution-estimates-and-increases.
- “2023 State Fact Sheets,” FFYF, July 31, 2023, https://www.ffyf.org/resources/2023/07/2023-state-fact-sheets.
- “2024 CCDBG State Fact Sheets,” FFYF.
- Ibid.
- “Fiscal Year 2024 Budget Summary,” U.S. Department of Education, https://www.ed.gov/sites/ed/files/about/overview/budget/budget24/summary/24summary.pdf.
- O’Keefe, et al., “How Do States Fund Pre-K?” Bellwether.
- “2025 Child Care and Early Learning State Fact Sheets,” FFYF.
- “Mapping PDG B-5 Participation Over Time,” FFYF, September 2024, https://www.ffyf.org/pdg-map.
- Ibid.
- “2025 Child Care and Early Learning State Fact Sheets,” FFYF.
- Friedman-Krauss, et al., “The State of Preschool 2024: State Preschool Yearbook,” NIEER.
- “2025 Child Care and Early Learning State Fact Sheets,” FFYF.
- Friedman-Krauss, et al., “The State of Preschool 2024: State Preschool Yearbook,” NIEER.
- Alabama Senate Bill 132 (2000), https://alison.legislature.state.al.us/files/pdf/SearchableInstruments/2000RS/PrintFiles/SB132-enr.pdf.
- Ala. House Bill 233 (2015), https://alison.legislature.state.al.us/files/pdf/SearchableInstruments/2015RS/PrintFiles/HB233-Int.pdf.
- “Alabama First Class Pre-K Program,” NIEER, 2024, https://nieer.org/yearbook/2024/state-profiles/alabama.
- “2023 Annual Report,” Alabama Department of Early Childhood Education, 2024, https://www.children.alabama.gov/wp-content/ uploads/2024/05/2023-Annual-Report.pdf.
- “Alabama State Profiles: 2005-2024,” NIEER, 2025, https://nieer.org/past-state-pre-school-year-books.
- “Data Dashboard,” Alabama Department of Early Childhood Education, 2024, https://www.children.alabama.gov/about/data-dashboard.
- “The P-3 Initiatives Aligned to Strong Start, Strong Finish Benchmarks 1-3,” Office of the Alabama Governor Kay Ivey, 2024, https://governor.alabama.gov/priorities/education/pre-three.
- “2024 Alabama State Profile: Appendix C Data,” NIEER, August 2025, https://nieer.org/sites/default/files/2025-08/appendixc_2024.pdf.
- “Annual Report 2023-2024,” Division of Early Learning, Florida Department of Education, 2024, https://www.fldoe.org/file/20628/2324-DEL-AnnualReport.pdf.
- Fla. Stat. § 1002.71, https://www.leg.state.fl.us/Statutes/index.cfm?App_mode=Display_Statute&Search_String=&URL=1000-1099/1002/ Sections/1002.71.html.
- “2023-2024 Market Rate Survey Report,” Division of Early Learning, Florida, 2024, https://www.fldoe.org/file/20628/2024-MRS-Report.pdf.
- Fla. Admin. Rule 6M-8.204, https://flrules.org/gateway/RuleNo.asp?title=DIVISION%20OF%20EARLY%20LEARNING%20-%20VOLUNTARY%20 PREKINDERGARTEN%20PROGRAM&ID=6M-8.204.
- “Florida State Profiles: 2006-2024,” NIEER, 2025, https://nieer.org/past-state-pre-school-year-books.
- Division of Early Learning, Florida Department of Education, 2024.
- Fla. HB 3 (2021), https://flsenate.gov/Session/Bill/2021/3/ByCategory.
- Fla. HB 7071 (2022), https://www.flsenate.gov/Session/Bill/2022/7071/BillText/er/PDF.
- Fla. HB 7039 (2023), https://laws.flrules.org/2023/108.
- Fla. Stat. § 1002.411, https://www.leg.state.fl.us/Statutes/index.cfm?App_mode=Display_Statute&Search_String=&URL=1000-1099/1002/ Sections/1002.411.html.
- Georgia Amendment 1, State Lottery for Education Amendment (1992), https://ballotpedia.org/Georgia_Amendment_1,_State_Lottery_for_Education_Amendment_(1992).
- Georgia House Bill 201 (1995), https://dlg.usg.edu/record/dlg_zlgl_563510980#text.
- Ga. Senate Bill 709 (1996), https://dlg.usg.edu/record/dlg_zlgl_578811747#text.
- Ga. SB 456 (2004), https://www.legis.ga.gov/api/legislation/document/20032004/33968.
- “Infusing a Culture of Education,” Bright from the Start: Georgia Department of Early Care and Learning, https://www.decal.ga.gov/documents/attachments/DECALBrochure.pdf.
- “Georgia’s Pre-K Program History,” Ga. DECAL, August 27, 2020, https://www.decal.ga.gov/documents/attachments/GaPreKFundingHistory.pdf.
- Ga. Comp. R. & Regs. R. 591-2-1-.01, https://rules.sos.ga.gov/gac/591-2-1-.01.
- “Georgia State Profiles: 2003-2024,” NIEER, 2025, https://nieer.org/past-state-pre-school-year-books.
- “Georgia’s Pre-K Program History,” Ga. DECAL.
- Ga. HB 686 (2025), https://www.legis.ga.gov/legislation/71019.
- Ga. HR 450 (2025), https://www.legis.ga.gov/api/legislation/document/20252026/234592.
- Const. of Ga. Art. I Sec. II Para. VIII, https://sos.ga.gov/sites/default/files/2022-02/state_constitution.pdf.
- “Oklahoma 2024 State Profile,” NIEER, 2025, https://nieer.org/yearbook/2024/state-profiles/oklahoma.
- William Gormley and Deborah Phillips, “The Effects of Universal Pre-K in Oklahoma: Research Highlights and Policy Implications,” Public Policy Institute, Georgetown University, October 2003, https://www.fcd-us.org/wp-content/uploads/2016/04/EffectsofUPKinOK.pdf.
- Okla. Statute 70 § 1-114(B), https://law.justia.com/codes/oklahoma/title-70/section-70-1-114/.
- “Oklahoma State Profiles: 2003-2024,” NIEER, 2025, https://nieer.org/past-state-pre-school-year-books.
- 70 O.S. § 18-201.1, https://www.oscn.net/applications/oscn/DeliverDocument.asp?CiteID=436942.
- “Oklahoma 2024 State Profile,” NIEER.
- “50-State Comparison of K-12 Funding,” Education Commission of the States, March 2024, https://reports.ecs.org/comparisons/k-12-funding-2024-02.
- Melanie Hanson, “U.S. Public Education Spending Statistics,” Education Data Initiative, updated February 8, 2025, https://educationdata.org/public-education-spending-statistics.
- West Virginia House Bill 1760 (1983), https://code.wvlegislature.gov/signed_bills/1983/1983-RS-HB1760-SUB%20ENR_signed.pdf.
- W.Va. Senate Bill 728 (2002), https://www.wvlegislature.gov/bill_status/bills_text.cfm?billdoc=SB728%20eng.htm&yr=2002&sesstype=RS&i=728.
- “West Virginia State Profiles: 2003-2024,” NIEER, 2025, https://nieer.org/past-state-pre-school-year-books.
- “West Virginia’s Universal Access to a Quality Early Education System (#2525),” W. Va. Code of State Rules, Title 126, Series 218, July 14, 2022, https://apps.sos.wv.gov/adlaw/csr/readfile.aspx?DocId=55504&Format=PDF.
- W.Va. Code § 18-9A-3, et seq., https://code.wvlegislature.gov/18-9A-3.
- Tamaya Browder, “How are Public Schools Funded in West Virginia?” West Virginia Center on Budget and Policy, April 3, 2025, https://wvpolicy.org/how-are-public-schools-funded-in-west-virginia.
- Louisiana House Bill 587 (2025), https://www.legis.la.gov/legis/BillInfo.aspx?i=248633.
- Mississippi House Bill 547 (2025), https://billstatus.ls.state.ms.us/2025/pdf/history/HB/HB0547.xml.
- South Carolina House Bill 3573 (2025), https://www.scstatehouse.gov/sess126_2025-2026/bills/3573.htm.
- Tennessee Senate Bill 270 (2025), https://wapp.capitol.tn.gov/apps/BillInfo/Default.aspx?BillNumber=SB0270&ga=114.
- Bojan Savis, “HB218-SB270 Fiscal Note,” Fiscal Review Committee, Tennessee General Assembly, March 15, 2025, https://www.capitol.tn.gov/Bills/114/Fiscal/HB0218.pdf.
- Texas House Bill 2779 (2025), https://capitol.texas.gov/tlodocs/89R/billtext/html/HB02779I.htm.
- Tex. HB 3297 (2025), https://capitol.texas.gov/tlodocs/89R/billtext/html/HB03297I.htm.
- Virginia House Bill 2538 (2025), https://lis.blob.core.windows.net/files/1033544.PDF.
- “State Fiscal Impact Statement – HB2538E,” Virginia Department of Planning and Budget, February 4, 2025, https://lis.blob.core.windows.net/files/1040831.PDF.
- Ibid.
- Friedman-Krauss, et al., “The State of Preschool 2024: State Preschool Yearbook,” NIEER.
- Ibid.
- Ibid.
- Daphna Bassok, et al., “What happens when families cannot access child care subsidies?” Brookings Institute, January 20, 2026, https://www.brookings.edu/articles/what-happens-when-families-cannot-access-child-care-subsidies/.
- Evie Blad, “Some Say the Case for Head Start Is Weak. Researchers Say They’re Wrong,” EdWeek, May 1, 2025, https://www.edweek.org/teaching-learning/trump-allies-say-the-case-for-head-start-is-weak-researchers-say-theyre-wrong/2025/05.
- “Explanatory Statement: Departments of Labor, Health and Human Services, Education, and Related Agencies Appropriations Act of 2026,” U.S. Congress, January 19, 2026, https://docs.house.gov/billsthisweek/20260119/DEF%20LHHS%20HS%20THUD%20-%20JES%20-%20Division%20 B%20-%20LHHS%20-%201-19-2026%20-%20Reduced%20File%20Size.pdf.