
Regional Resource by Senior Policy Analyst, Cody Allen | callen@csg.org
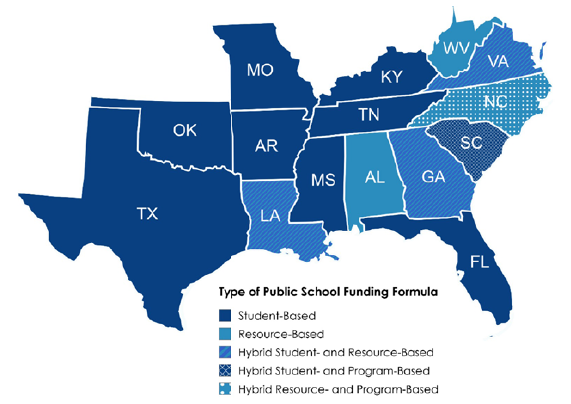
State funding for public K-12 education is typically calculated using a complex methodology based on each local district’s factors or program-based formulas.* While these usually fall under one of two formulas, student-based or resource-based, several utilize a hybrid or program-based formula.
- Student-based formulas assign a base cost to the education of an average full-time equivalency (FTE) student and calculate state funding for districts primarily by multiplying that cost by districts’ enrollment figures. The state accounts for the additional cost of educating specific categories of students by adjusting its distributions by applying multipliers to the base cost, adding flat, per-student dollar amounts to the base cost, and/or through program-specific allocations.
- Resource-based formulas determine the cost of delivering education in a district based on the cost of the resources, such as staff salaries and course materials, required to do so. The state may separately account for the additional cost of educating specific categories of students by distributing flat, per-student dollar amounts and/or through program-specific allocations.
- Program-based formulas determine the cost of delivering education in a district based on the cost of specific programs and initiatives, and they generally do not itemize the expenses related to resources or the costs of delivering education to particular categories of students.
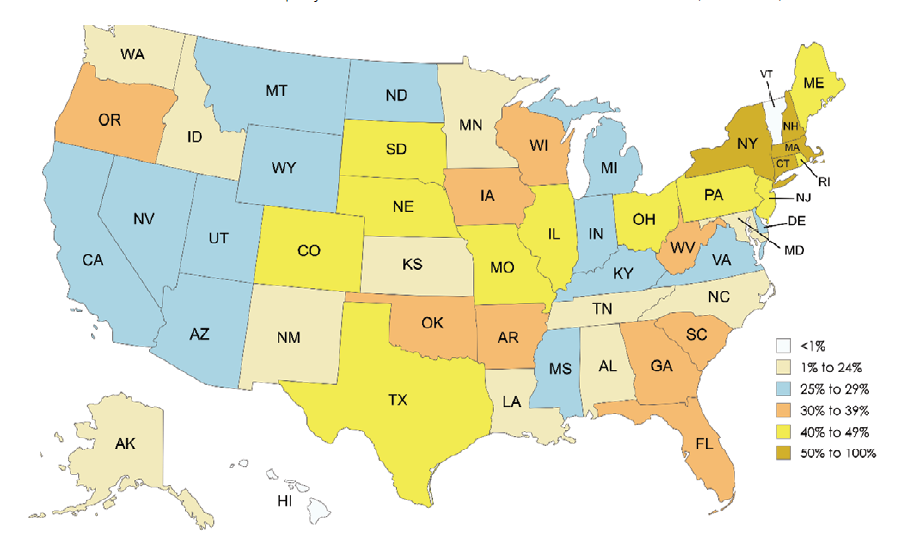
Only Alabama and West Virginia utilize a primarily resource-based model in the South, with the Yellowhammer State recently approving a move away from this outdated model. Still, several others — Georgia, Louisiana, North Carolina, and Virginia — use a hybrid of resource- and other-based models. Half of the South uses a student-based formula, the most common national model in more than 40 states. Further, only six states — including three in the South — do not include some form of poverty-based multiplier in their funding formulas.
This CSG South Regional Resource compares these Southern state school funding models and recent legislation to reform or change these systems, specifically concerning K-12 public education. Given the breadth of the education finance discussion, this resource can be viewed as part one in a series examining all aspects of school funding reforms, including prekindergarten, charter schools, choice opportunities, and special education.†
*In an effort to mitigate this complexity, this report features a Glossary on page 40 to provide context to frequently used abbreviations and terminology in this world of school funding.
†In this report, when using the term handicapped or disabled, it is because the explicit language used in state statute is not reflective of currently used descriptors amongst special education best practices. In many cases, this statutory language further illustrates the decades-old foundations of these funding formulas.
FIGURE 1. Comparison of CSG South Member States School Funding Formulas†
All Funding Is Local: A Brief Look at How School Revenue Is Generated
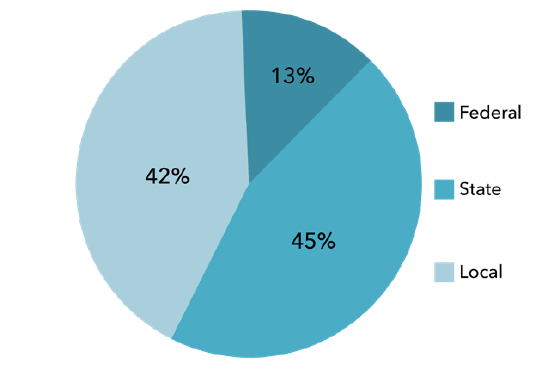
FIGURE 2. Public School System Funding Sources, U.S. Average (FY 2023)
† Of note, these descriptors represent the type of funding utilized for the 2024-2025 academic year with any recent updates noted in each states’ individual section
In the U.S., local control is a founding principle of public education, which makes sense given that the most significant financial burdens for financing public K-12 education fall on state and local governments. Specifically, more than 36 percent of public school funding comes via local property tax levies. While a stable and easily predictable funding source compared to other sales or income-based taxes, the main drawback of the reliance on property taxes to support public education is the disparity of property values among geographical areas as well as tax base inequality, as certain commercial, government, or public service-related property owners have significant exemptions or waivers of property taxes.³
To that end, states often use some form of equalization or, in Virginia’s case, a statistical tool known as the Local Composite Index (LCI) to allocate funding for public education based on local wealth and need, aiming to promote equitable resource distribution among school districts. By considering local tax revenues, student enrollment numbers, and demographic characteristics, the LCI helps adjust state funding to reflect the economic realities of different regions. This system has gained prominence as educational equity has become a central issue in discussions about school finance reform, particularly in areas with large populations of disadvantaged students, although often by another name, such as sparsity or poverty funding multipliers. The LCI’s primary advantage lies in its potential to address disparities in school funding, ensuring that wealthier districts contribute more to the overall funding pool, thereby supporting underfunded areas.⁴
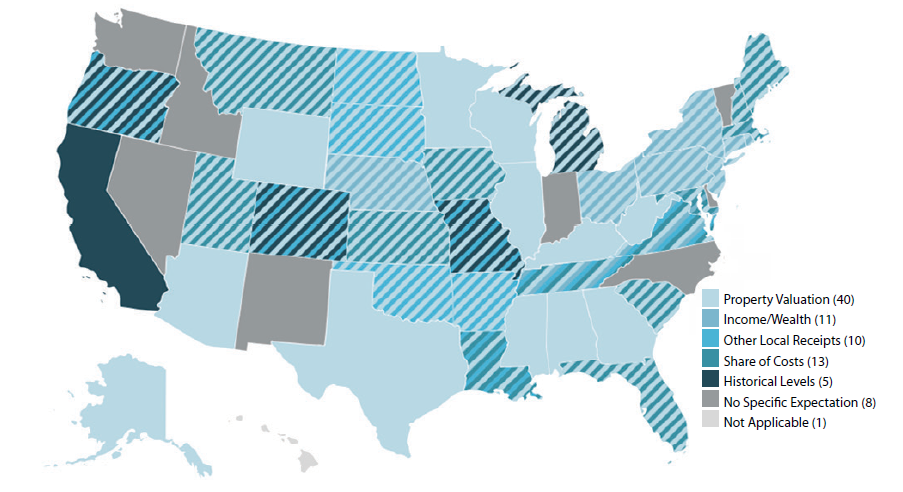
In most states, the education funding formula includes an expectation that the local school district will contribute some portion of the amount needed to fund education in that district. This expected local share is subtracted from the total amount calculated by the state to be necessary to educate the district’s students, and the difference is the amount of state education funding the district will receive, typically regardless of whether the locality raises the expected amount in education taxes.⁵ The amount of the expected local contribution varies from district to district, and states base their expectations on several different factors or a hybrid mix of factors, including:
- Property Valuation: Applying a specific property tax rate to the total valuation of local, taxable property to determine the revenue a district can reasonably be expected to raise.
- Income and/or Wealth: The formulation of a metric to assess the revenue a district can reasonably be expected to raise, as determined by indexing relative purchasing power or comparing regions with higher average wage rates.
- Other Local Receipts: Similar to above, but calculated based on reasonable local revenue a district can be expected to raise via non-property tax levies.
- Cost Sharing: The application of a set percentage to the total amount needed to fund education in the district compared to the expected local revenues.
- Historical Levels or Trends: Examining past trends and historical revenues to determine reasonable expectations of what amount of local revenue should be contributed to education.
- Unspecified or Unapplicable: Typically permits localities to raise optional local funds or levies for educational purposes, but no set expected local contribution.⁶
FIGURE 3. How Do States Determine the Expected Local Share of Education Funding?
Supplemental Legend to State Local Share Calculations
| State | Property Valuation | Income or Wealth | Other Local Receipts | Share of State Costs | Historic Levels | None or Non-Specific |
|---|---|---|---|---|---|---|
| Alabama | ✔ | |||||
| Alaska | ✔ | |||||
| Arizona | ✔ | |||||
| Arkansas | ✔ | ✔ | ||||
| California | ✔ | |||||
| Colorado | ✔ | ✔ | ✔ | |||
| Connecticut | ✔ | ✔ | ||||
| Delaware | ✔ | |||||
| Florida | ✔ | ✔ | ||||
| Georgia | ✔ | |||||
| Hawai’i | ✔ | |||||
| Idaho | ✔ | |||||
| Illinois | ✔ | |||||
| Indiana | ✔ | |||||
| Iowa | ✔ | ✔ | ||||
| Kansas | ✔ | ✔ | ||||
| Kentucky | ✔ | |||||
| Louisiana | ✔ | ✔ | ✔ | |||
| Maine | ✔ | ✔ | ||||
| Maryland | ✔ | ✔ | ✔ | |||
| Massachusetts | ✔ | ✔ | ✔ | |||
| Michigan | ✔ | ✔ | ||||
| Minnesota | ✔ | |||||
| Mississippi | ✔ | |||||
| Missouri | ✔ | ✔ | ✔ | |||
| Montana | ✔ | ✔ | ||||
| Nebraska | ✔ | ✔ | ||||
| Nevada | ✔ | |||||
| New Hampshire | ✔ | ✔ | ||||
| New Jersey | ✔ | ✔ | ||||
| New Mexico | ✔ | |||||
| New York | ✔ | ✔ | ||||
| North Carolina | ✔ | |||||
| North Dakota | ✔ | ✔ | ||||
| Ohio | ✔ | ✔ | ||||
| Oklahoma | ✔ | ✔ | ||||
| Oregon | ✔ | ✔ | ✔ | |||
| Pennsylvania | ✔ | ✔ | ||||
| Rhode Island | ✔ | ✔ | ||||
| South Carolina | ✔ | ✔ | ||||
| South Dakota | ✔ | ✔ | ||||
| Tennessee | ✔ | ✔ | ✔ | ✔ | ||
| Texas | ✔ | |||||
| Utah | ✔ | ✔ | ||||
| Vermont | ✔ | |||||
| Virginia | ✔ | ✔ | ✔ | ✔ | ||
| Washington | ✔ | |||||
| West Virginia | ✔ | |||||
| Wisconsin | ✔ | |||||
| Wyoming | ✔ | |||||
| Total # of States | 40 | 11 | 10 | 13 | 5 | 9 |
Advocates argue that equalization formulas and the LCI accurately reflect local conditions, leading to better-targeted educational resources and improved student outcomes in low-income communities. Furthermore, the LCI is updated biennially, allowing it to respond to changes in local economic conditions, which is crucial in maintaining a fair allocation of resources over time.⁹
However, the LCI is not without its criticisms. Detractors point to its lack of transparency and inflexibility, which can hinder schools in low-income areas from accessing necessary funding.¹⁰ Studies have indicated that districts serving predominantly minority students often receive significantly less funding per pupil than their counterparts in wealthier areas, exacerbating existing educational inequities. The COVID-19 pandemic further intensified these challenges, with reduced state revenues disproportionately impacting schools reliant on state funding.¹¹
Considering these concerns, calls for reform have emerged from education research groups such as the Learning Policy Institute or School Finance Indicators Project, including proposals for a federal commission on school finance to explore more equitable funding mechanisms.¹² As debates continue over the efficacy of the LCI in achieving educational equity, the ongoing examination of its impacts highlights the complexities and challenges inherent in school funding policies.
The most cited use of the LCI as a distinct methodology comes from the Commonwealth of Virginia, where the LCI is typically based on three factors, each given different weights:§
- True Value of Real Property (50 percent)
- Adjusted Gross Income of County Residents (40 percent)
- Taxable Retail Sales (10 percent)¹³
Among the Southern states reviewed, only Virginia employs a methodology that is explicitly labeled an “LCI.” Other states use local equalization or expected local share models that functionally serve the same purpose but differ in statutory structure, methodology, and transparency. For states interested in a model approximating the Commonwealth of Virginia’s approach, the following formula, utilized by the state’s Department of Education for the 2024–2026 biennial budget, may provide an estimate as to what supplemental support an LCI would provide to other states in the region.
States that use an LCI or equivalent often experience more responsive funding mechanisms that adjust to local wealth or enrollment changes. These systems can reduce disparities, especially for low-wealth districts. However, challenges include opaque calculations, insufficient adjustments for concentrated poverty, and reliance on outdated data. Regardless of the methodology used, accounting for local disparities will remain an important factor in any education funding discussion, as property taxes have historically been the main driver of the local portion of the school funding equation.¹⁵
§ The example weights provided are from Virginia’s student funding formula and are further discussed in the Virginia overview on page 35 of this report.
FIGURE 4. Virginia Department of Education’s Budget Office LCI Calculator (2024-2026)
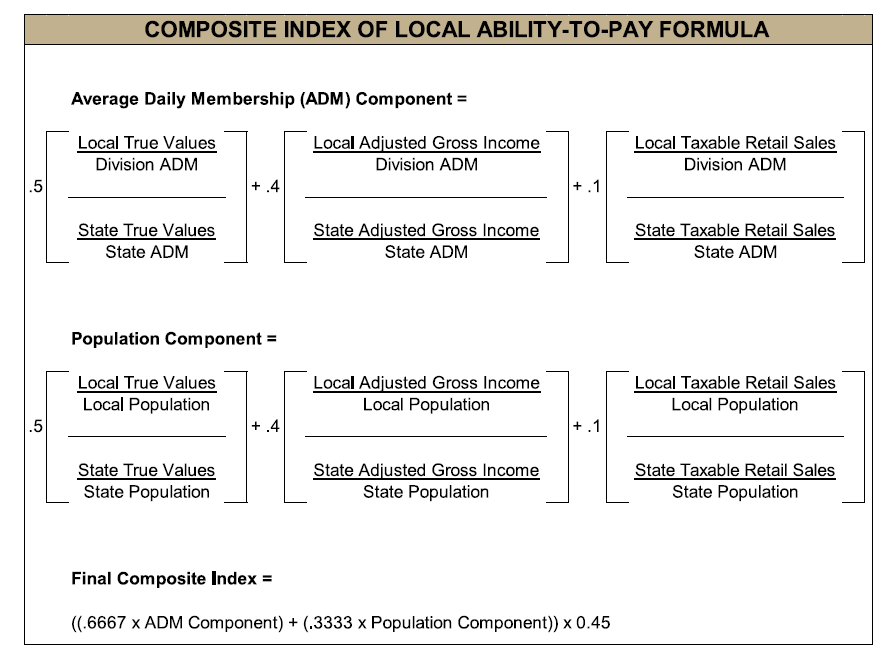
FIGURE 5. Local Property Tax Revenue as a Share of Public Education Revenue (2020-2021)
The ABCs and 123s of Education Funding in the South
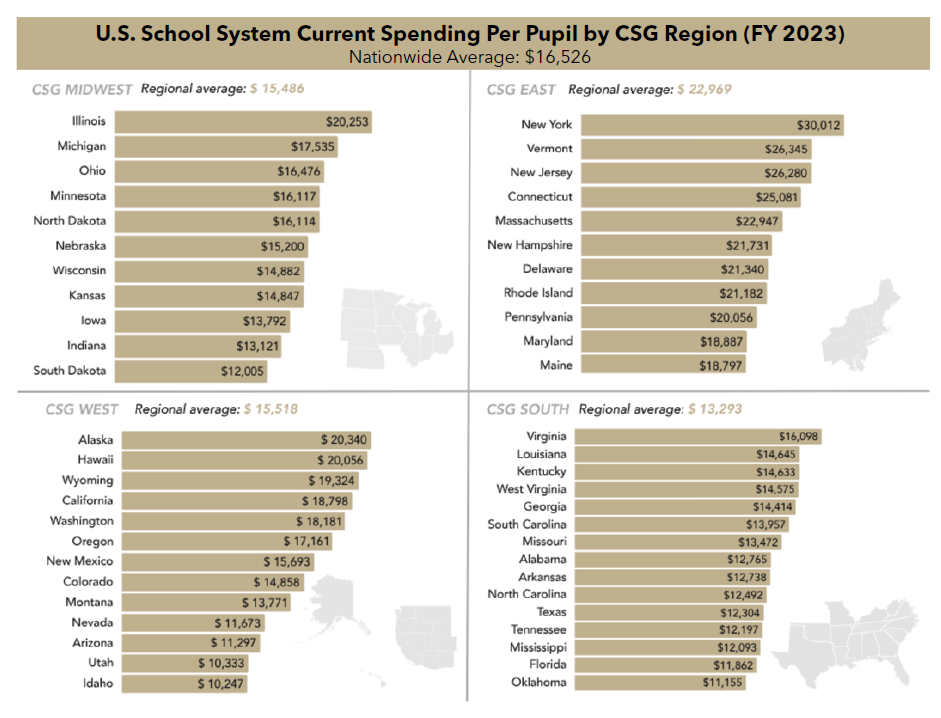
FIGURE 6. Overview of Estimated Per Pupil Public PreK-Grade 12 Education Funding by CSG Region
Alabama
Alabama has a primarily resource-based funding formula. It determines the cost of delivering education in a district based on the cost of the resources, such as staff salaries and course materials, required to do so. The categories of students considered in Alabama’s funding policy are students in certain grade levels, English-language learners (ELLs), students from low-income households, students identified as gifted, and students enrolled in career and technical education (CTE) programs. Alabama expects school districts to contribute to the funding of their public schools, with the amount of the local share based on the districts’ property values. Districts can raise and keep additional local revenues for regular district operations. Alabama considers specific grade levels in the allocation of funding for staff costs. A supplemental, flat dollar amount is provided for students from low-income households. Services for English-language learners and students identified as gifted, and some CTE services, are funded through program-specific allocations, as illustrated by Table 1.¹⁹
Alabama provides different funding levels for students in various grade levels through its resource-based formula. This formula assigns student-to-teacher ratios to four different grade spans and provides funding for teacher positions accordingly. These ratios determine the number of teaching units a district is entitled to. Principals, assistant principals, guidance counselors, and librarians are also assigned to elementary schools by student-to-staff ratios that differ from those used for middle and high schools. Once all staff units are calculated for a district, with grade-level variation considered, the units are converted into dollar amounts using a salary matrix that considers staff training and experience; also included are minor per-unit additions for staff benefits, classroom materials, and other expenses. These amounts form the basis of the districts’ state education funding. For the 2024–2025 academic year, the average funding from the state’s Education Trust Fund Foundation Program is around $7,700 per pupil.²⁰
However, in recognition of the downsides of a resource-based model, this year lawmakers prioritized Senate Bill 305 (2025). The Renewing Alabama’s Investment in Student Excellence (RAISE) program would allocate additional funding to districts based on their populations of ELLs, special education, gifted students, and charter school enrollees.²¹ Once implemented, the bill will transfer more than $375 million from the state’s Educational Opportunities Reserve Fund—an account for dedicated savings for educational purposes from budget surpluses—to seed the new RAISE fund. The initial first-year transition would allocate approximately $100 million of those funds, with $125 million and $175 million for the second and third years of implementation. According to fiscal estimates, lawmakers must reappropriate additional funding after three years. The bill unanimously passed both chambers and was signed by the governor on May 6, 2025.
TABLE 1. Alabama’s Old Resource-Based Formula Ratios (2024-2025)
| Grade Level(s) | Student-to-Teacher Ratio |
|---|---|
| Kindergarten — Grade 3 | 14.25-to-1.00 |
| Grades 4 — 6 | 20.43-to-1.00 |
| Grades 7 — 8 | 19.70-to-1.00 |
| Grades 9 — 12 | 17.95-to-1.00 |
Table 2 below highlights the weighted caps under which the new RAISE formula will operate above a new base funding of $7,547 per student; notably, students may qualify for and be assigned a weight from more than one qualifying group.²²
TABLE 2. Alabama RAISE Act New Per-Pupil Weights (2026-2027 School Year)
| Special Student Group | Definition | Per-Pupil Weighted Modifier |
|---|---|---|
| Tier III – Special Education | Qualifying students with Individualized Education Plans (IEP) denoting emotional disturbance or disability, hearing impairment, orthopedic impairment, visual impairment, deaf-blindness, and/or traumatic brain injury. | ≤150 percent |
| Tier II – Special Education | Students diagnosed with autism spectrum disorder, intellectual disability, developmental disability, or multiple disabilities. | ≤50 percent |
| Tier I – Special Education | Students with a specific learning disability, speech/language impairment, or other health impairment. | ≤25 percent |
| Poverty | Students identified through direct certification – participation in free and reduced lunch. | ≤20 percent |
| English Language Learners | Students identified as ELLs as part of their education plan. Further, an additional weight of up to 5 percent may be generated for each ELL in an ELL-concentrated district. | ≤15 percent |
| Public Charter Student | Generated by students whose charter school is located physically within a county or city school system that receives local funding from revenue streams of more than 10 mills of the ad valorem property taxes for the school system in which the charter is located. | ≤10 percent |
| Gifted Learners | Each district will generate an assumed 5 percent ADM of gifted students in high-achievement programs. | ≤5 percent |
Arkansas
Arkansas has a primarily student-based formula. It assigns a cost to the education of a student with no special needs or services, called a base amount, and provides increased funding to educate specific categories of students. The categories of students considered in Arkansas’ funding policy are students in certain grade levels; English-language learners; low-income students and students in high-poverty districts; students identified as gifted; students enrolled in career and technical education programs; students in alternative learning environments; and students enrolled in small, isolated, and sparsely populated districts. Supplemental funding for English-language learners, low-income students, students in small, isolated, and sparsely populated districts, and students in alternative learning environments is provided through per-pupil dollar allocations. Services for students identified as gifted, students in CTE programs, and students with high-cost disabilities are funded through program-specific allocations.²³
The Arkansas Literacy, Empowerment, Accountability, Readiness, Networking, and School Safety (LEARNS) Act of 2023 updated this formula to increase the base amount to $7,771 per student for the 2024–2025 academic year.²⁴ This amount will increase annually after being multiplied by the average daily membership for the district’s previous year. Additionally, for a school district whose net revenues are less than the sum of 98 percent of the uniform rate of tax multiplied by the property assessment of the school district, the state Division of Elementary and Secondary Education shall distribute to the school district the difference between the net revenues distributed to the school district for the calendar year immediately preceding the current school year and the sum of 98 percent of the uniform rate of tax multiplied by the property assessment of the school district. If a district’s net revenues exceed 98 percent, the state must recoup the difference between the net revenues and the property assessment.²⁵
Beginning with the 2024–2025 school year and in the future, the additional per-pupil funding includes:
- $5,086 for each student enrolled in an alternative learning environment for the prior year
- $1,613 per student for districts with more than 90 percent of students eligible for free-and-reduced lunch the prior year
- $1,076 per student for districts with between 70 and 90 percent free-and-reduced lunch
- $538 per student for districts with less than 70 percent free-and-reduced lunch
- $366 for each ELL to be used on eligible activities and to supplement the school lunch funds
- A tiered funding structure for students enrolled in a secondary vocational center, to be determined by the state Division of Career and Technical Education
In addition to the updated public school funding formula, the law allows up to 90 percent of the per-student funding rate for permitted private educational expenses, such as tuition, books, testing, supplies, and other costs. For the 2024–2025 school year, that equated to approximately $6,856 and up to $7,618 for students previously participating in the Succeed Scholarship program, a limited voucher program for special needs students.²⁶
Florida
The Sunshine State mainly features a student-based funding formula that assigns a base amount to the education of a student with no special needs or services and provides increased funding to educate specific categories of students. The categories of students considered in Florida’s funding policy include students in certain grade levels, English-language learners, students with disabilities, students identified as gifted, students enrolled in CTE programs, students in accelerated programs, and students in smaller districts. However, the state is one of only six that does not feature a poverty-based multiplier.²⁷
TABLE 3. Florida Education Finance Program (FEFP) Per-Pupil Weight Comparisons
| Category | Special Student Population / Bonus FTE | Per-Pupil Funding Modifier |
|---|---|---|
| Special Student Population | Kindergarten — Grade 3 | 1.118 |
| Grades 9 – 12 | 0.978 | |
| English Language Learners | 1.192 | |
| Special Education Students (Grades K-3) | 1.118 | |
| Special Education Students (Grades 9-12) | 0.978 | |
| Special Education Students (Support Level IV) | 3.697 | |
| Special Education Students (Support Level V) | 5.992 | |
| CTE Programs (Grades 9-12) | 1.079 | |
| Bonus FTE Categories | Advanced Placement (AP) Test Passage | 0.160 |
| College Board AP Capstone Diploma Recipient | 0.300 | |
| International Baccalaureate (IB) Test Passage | 0.160 | |
| Advanced International Certificate of Education (AICE) Test Passage | 0.160 | |
| AICE Test Passage (Half-Credit Class) | 0.080 | |
| IB or AICE Diploma Recipient | 0.300 | |
| Career and Professional Education Act (CAPE) Digital Tool Certificate Recipient (Grades K-8) | 0.025 | |
| CAPE Career-Themed or Industry Certification Course Completion | 0.200 | |
| CAPE Industry Certification Recipient (College-Credit) | 0.200 | |
| CAPE Industry Certification Recipient (Non-College-Credit) | 0.100 | |
| CAPE Acceleration Industry Certifications (15-29 College-Credit Hours) | 0.500 | |
| CAPE Acceleration Industry Certifications (30 or More College-Credit Hours) | 1.000 | |
| Students Completing Three or More Single-CTE Program Courses | 0.300 | |
| Early High School Graduate (1 Semester Ahead of Cohort) | 0.250 | |
| Early High School Graduate (1 or More Years Ahead of Cohort) | 0.500 | |
| Dual Enrollment – Early College Program Student | 0.160 | |
| Dual Enrollment – General Education Student | 0.080 | |
| Dual Enrollment – Associate Degree Recipient | 0.300 | |
| Dual Enrollment – CAPE Industry Certification Course Completion | 0.080 |
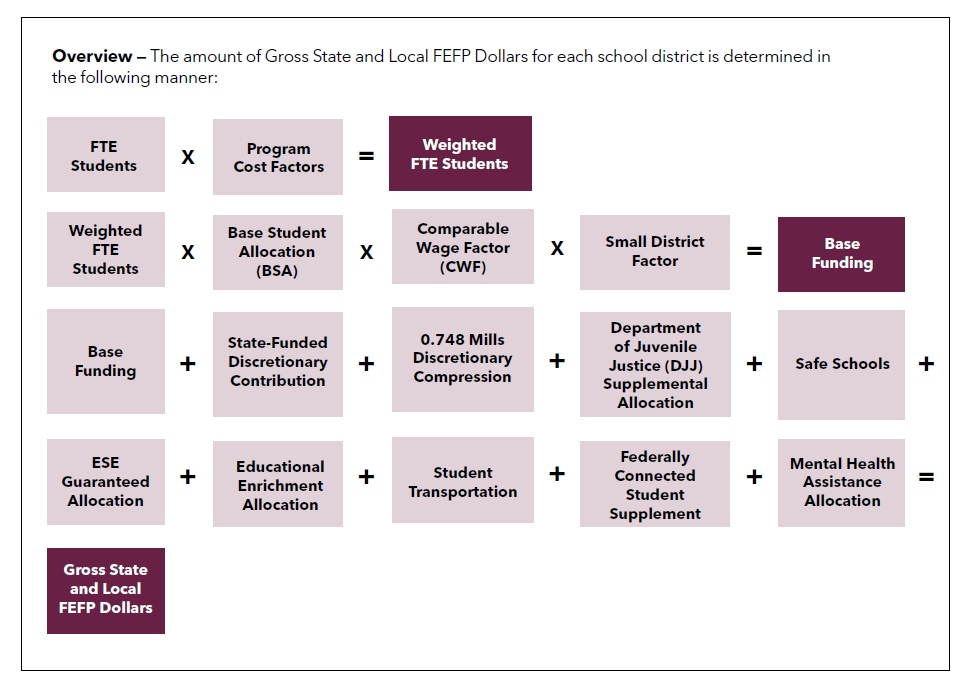
For the 2024–2025 academic year, the base funding was approximately $5,331 in state funds or $8,959 in combined federal, local, and state funds per FTE student, with specific multipliers as illustrated above. Notably, students in grades 4 through 8 do not receive any additional grade-level or special education weighted funding. For students who score a three or above to pass an AP subject test, school districts may add a 0.16 multiplier for each qualifying student. The state also adds a 0.16 bonus for students enrolled in an IB program who score a four or higher on a subject test. Various other multipliers for exceptional education programs, such as AP, AICE, and IB, are available as an additional per-pupil modifier for eligible students.²⁹
During the 2024 legislative session, lawmakers passed a measure to expand the state’s discretionary supplement education fund. Previous statutory language only permitted its allocation to lab schools. The new law allows the discretionary funds to be sent to charter schools sponsored by a state college or university.³⁰ It also updated the 2023 law creating the Educational Enrollment Stabilization program, which provided supplemental state funds to school districts to prevent instability due to FTE enrollment changes throughout the school year. For the 2023–2024 academic year, the state appropriated approximately $23.5 million to 10 school districts and the statewide virtual school to offset enrollment changes. The new law requires annual appropriations of at least $250 million to keep the fund solvent due to anticipated enrollment changes as Florida’s school voucher program expands.³¹
FIGURE 7. Distribution of State Dollars to the Florida FEFP (2024-2025)
Georgia
The Peach State is one of only six states that does not include some form of poverty multiplier in its formula. The state’s Quality Basic Education (QBE) formula is more than four decades old and the subject of much debate as lawmakers look to add piecemeal changes or reform the entire QBE and create a new method of calculating school funding.³³ According to the state Department of Education, adding a poverty weight to the existing QBE could cost up to $300 million in new funding costs for the state.³⁴ However, the existing QBE features 19 distinct student weight categories as illustrated below.³⁵
TABLE 4. Fiscal Year 2025 GADOE QBE Funding Formula and Amounts
| Student Category | Total Per-Pupil Weight | Total Per-Pupil Cost |
|---|---|---|
| Kindergarten | 1.6901 | $5,394 |
| Kindergarten (Early Intervention) | 2.0951 | $6,687 |
| Grades 1 – 3 | 1.3029 | $4,159 |
| Grades 1 – 3 (Early Intervention) | 1.8388 | $5,869 |
| Grades 4 – 5 | 1.0417 | $3,325 |
| Grades 4 – 5 (Early Intervention) | 1.8340 | $5,854 |
| Grades 6 – 8 (Middle Grades) | 1.0349 | $3,303 |
| Grades 6 – 8 (Middle School) | 1.1439 | $3,651 |
| Grades 9 – 12 | 1.0000 | $3,192 |
| CTAE (Grades 9 – 12) | 1.1762 | $3,754 |
| Special Education I | 2.4763 | $7,904 |
| Special Education II | 2.9213 | $9,324 |
| Special Education III | 3.7151 | $11,857 |
| Special Education IV | 6.0106 | $19,184 |
| Special Education V | 2.5307 | $8,077 |
| Gifted Education | 1.7340 | $5,534 |
| Remedial Education | 1.3698 | $4,372 |
| Alternative Education | 1.5026 | $4,796 |
| ESOL / ELL Education | 2.6313 | $8,398 |
While the QBE and an additional poverty multiplier will remain at the forefront of the legislative debate, lawmakers did include some provisions to increase K-12 school funding in their $37.8 billion funding measure, House Bill 68 (2025). More specifically, as part of a one-time pilot program, up to 131 qualifying school districts—slightly more than 72 percent of all the state’s public districts—whose student population comprises mostly children from lower-income families, will share $15.3 million in state funds.** However, this poverty support may only amount to an increase of less than $40 per pupil instead of the more than $1,000 per pupil that some education advocates argue the state needs to spend on its low-income students.³⁷ Further, the budget also included an additional $5.9 million in funding in the form of sparsity grants to support small school districts whose base student population is insufficient to cover operating or personnel costs.³⁸
Kentucky
The Support Education Excellence in Kentucky (SEEK) is the state’s primary student-based formula, first enacted in 1990. The additionally weighted categories of students considered in the SEEK funding policy are ELLs, low-income students, students with disabilities, students identified as gifted, and students enrolled in CTE programs. Supplemental funding is provided for students identified as gifted, and students enrolled in career and technical education programs are funded through program-specific allocations. The Commonwealth is one of four states in the South that do not provide different funding amounts based on student grade levels.³⁹
For the most recent school year, the base SEEK per-pupil amount was $4,326, and the statutorily permitted add-ons for special student categories were as follows:⁴⁰
TABLE 5. SEEK Add-On Weights and Amounts (2024-2025)
| Student Funding Add-On Categories | Per-Pupil Add-On Weights |
|---|---|
| Exceptional Education – High Intervention (Hearing, Visual, Deaf-Blind, Autism, Emotional/Behavioral, Traumatic Brain Injury, Intellectual, or Multiple Impairments and Disabilities) | 2.3500 |
| Exceptional Education – Moderate Intervention (Specific Learning, Orthopedic, Developmental, Mild Intellectual, or Other Health Impairments and Disabilities) | 1.1700 |
| Exceptional Education – Low Intervention (Speech/Language Impairments and Disabilities) | 0.2400 |
| At-Risk / Low-Income Student Adjustment (National School Lunch Program) | 0.1500 |
During the 2024 legislative session, lawmakers enacted House Bill 499 (2025) to add a new supplemental funding mechanism for career and technical education. The measure modified the CTE supplemental funding distribution by replacing the existing calculation for locally operated programs and expanding permitted uses to include state-operated centers beginning in fiscal year 2025. The measure requires both local and state-operated programs and centers to maintain eligibility for federal funding to receive supplemental funding. It permits local districts to request that their funding allocation be used for students participating in CTE programs in grades five through eight. The measure also creates a CTE innovation and support fund, from which operating funds from the four state-operated centers are converted to local control, and other funds received will have a modified distribution beginning in fiscal year 2025.⁴²
** For context, if split evenly, each qualifying district would receive approximately $116,794 in one-time funds as part of the pilot program.
Louisiana
The Pelican State utilizes the Minimum Foundation Program (MFP) as a hybrid funding formula, comprising both student- and resource-based aspects. For the 2024–2025 school year, the base per-pupil amount for the MFP was $4,015.⁴⁴ Somewhat uniquely, the state’s Board of Elementary and Secondary Education (BESE) must adopt the formula annually and then allocate it to school districts as a “block grant,” providing significant flexibility to individual districts after satisfying mandatory requirements.⁴⁵
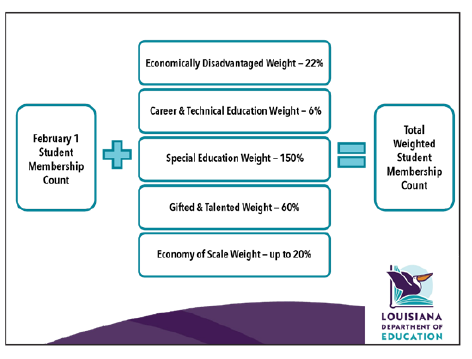
FIGURE 8. Louisiana MFP Infographic
Specifically, local education authorities must follow the 70 percent expenditure criteria by spending at least that percentage on direct school-level costs such as instruction, pupil and instructional support, and school administration. Localities scoring below this requirement do not have the same flexibility. They must submit corrective action and spending plans to the state Department of Education to increase targeted spending in these direct areas.⁴⁶
The state’s weighted student count includes five different weights for specific student or education groups to comprise the “Level I” weight count, or primary state funding formula. Table 6 lists these weighted percentages and the average statewide for the additional per-pupil funds allocated beyond the base MFP rate.⁴⁷
TABLE 6. Louisiana MFP Additional Weights (2024-2025)
| MFP Formula Unit(s) | Definition | MFP Weights | Statewide Average Per-Pupil Add-On |
|---|---|---|---|
| Students with Disabilities | Eligible students are those receiving one or more of the 16 identified special education services and using a current IEP. | 150 percent | $3,929.65 |
| Gifted and Talented Students | Students who qualify for a gifted and/or talents education plan. | 60 percent | $1,525.46 |
| Economically Disadvantaged | Includes students qualifying for Medicaid, TANF, SNAP, McKinney-Homeless, ELLs, and National Lunch Program. | 22 percent | $572.83 |
| Economy of Scale | Provides a variable additional weighted student amount for city and parish school systems with less than 7,500 students. | ≤20 percent | $189.99 |
| Career and Technical Education | This unit accounts for each CTE course a student is enrolled in across the fall and spring semesters. | 6 percent | $157.89 |
Mississippi
In 2024, lawmakers in the Magnolia State enacted House Bill 4130 (2024) to replace the decades-old adequate education program with the Mississippi Student Funding Formula (MSFF). Before enacting the new formula law, Mississippi was one of only two states nationally that did not feature an ELL multiplier or weight in per-pupil funding.⁵⁰ The law changed the student-based formula to an average net enrollment (ANE) instead of the prior personnel-based average daily attendance (ADA). It also augments the base student amount (BSA) for special student categories, including concentrated and individual poverty measures, ELLs, special education, gifted students, CTE, and sparsity.⁵¹
Most notably, the law now requires the BSA to be recalculated every four years, beginning with Fiscal Year 2029, and includes interim opportunities to adjust for inflation. The new formula is projected to increase total state funding for public schools by $200 million in Fiscal Year 2025, bringing total funding to $2.96 billion. The Mississippi Department of Education (MDE) will be involved in certifying certain special student categories, who, instead of a multiplier, will be assessed at a different base rate than “traditional” students. For Fiscal Year 2025, the BSA was calculated as $6,695. For the next three fiscal years, this BSA will be subject to an inflationary component that will increase by an annual rate of 25 percent of the BSA multiplied by the 20-year average consumer price index (CPI), which measures the rate of inflation.⁵²
FIGURE 9. Mississippi Public School Funding Infographic
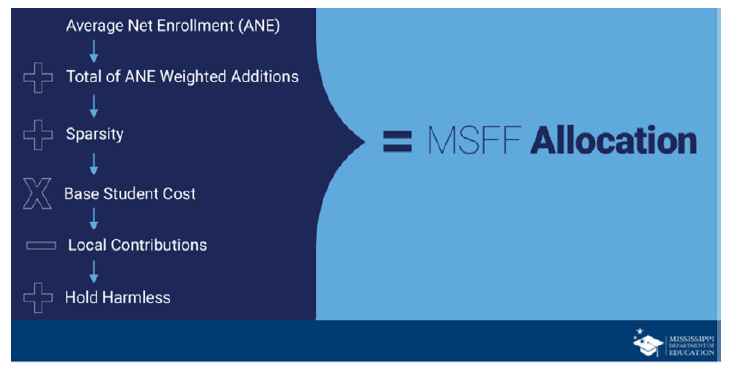
TABLE 7. MSFF Weighted Categories (2025-2026)
| Student Category | Definition | Per-Pupil Weighted Modifier | Total Estimated Per-Pupil Cost |
|---|---|---|---|
| Special Education – Tier III | Deaf-blind, Multiple Disabilities, Traumatic Brain Injury, and/or Visually Impaired. | 1.3000 | $15,399 |
| Special Education – Tier II | Autism, Emotional Disability, Hearing Impaired, Intellectual Disability, Other Health Impairment, and/or Orthopedic Impairment. | 1.1000 | $14,060 |
| Special Education – Tier I | Language/Speech Impaired, Developmental Delay, and/or Specific Learning Disability. | 0.6000 | $10,713 |
| Low-Income Students | Identified through “direct certification” by the MDE and automatically identified as low-income any student whose family qualifies for a means-tested program like the National School Lunch Program, Head Start, Medicaid, SNAP, TANF, or the FDPIR. It also applies to students who are homeless, in foster care, runaways, or migrants. | 0.3000 | $8,704 |
| English-Language Learners | In addition to ELLs, it includes English as a Second Language (ESL) and/or Bilingual Services. | 0.1500 | $7,700 |
| Career and Technical Education | Applied to each high school student enrolled in at least one CTE course; however, it only applies once, no matter how many CTE courses a student is enrolled in. | 0.1000 | $7,365 |
| Concentrated Poverty | Based on each student identified as low-income in the previous MDE process above a threshold of 35 percent in the district. | 0.1000 | $7,365 |
| Sparsity | Applied after other weights for districts or charters with fewer than eight students per square mile within their boundaries. The specific weight is calculated by subtracting the number of students per square mile from eight and then applying this figure as a percentage. | ≤0.0800 | Varies |
| Gifted | Applied to 5 percent of all students in each district, regardless of how many students are identified as “gifted.” | 0.0500 | $7,030 |
Missouri
The Show-Me State uses a student-based formula, with a base per-pupil amount of $6,375, with additional weights for special student populations. The Missouri School Funding Formula (MSFF) was established via Senate Bill 287 (2005) in response to litigation and took effect during the 2006-2007 school year.⁵⁴ The foundation of the MSFF is the State Adequacy Target (SAT), which, before its recent update, had not been updated from the base amount since 2020. The state moved from a tax-rate-driven to a student-needs-based funding formula with its enactment.⁵⁵
Uniquely, Missouri considers regional purchasing power, calculated as one plus 15 percent of the difference of the regional wage ratio minus one, at a rate which cannot be less than one. Missouri’s method of determining adequacy is a metric known as the Dollar Value Modifier (DVM). The DVM is intended to address the regional differences in labor costs around the state to provide equal ability to school districts to recruit and retain educators and other school staff. This is a ratio where the state Office of Management and Budget divides the regional wage per job by the state median wage for each DVM calculation.⁵⁶
Current MSFF (April 2025) =
WADA/WAM × SAT × DVM — Local Effort = State Funding.
The new current formula consists of the Weighted Average Daily Attendance (WADA)/Weighted Average Membership (WAM), which is the pupil count with a portion based on average membership or enrollment beginning in the 2025-2026 school year, multiplied by the State Adequacy Target (SAT). This unit is calculated as the average current expenditures of Performance Districts and recalculated every two years, utilizing data from the current list of these districts. The calculation uses baseline expenditure data from the initial estimate and adds any additional state revenue received, capped at 5 percent growth per recalculation. It is then multiplied by a Dollar Value Modifier to account for districts in areas of the state with higher wage rates by awarding additional funding.⁵⁷
During the 2024 legislative session, lawmakers passed Senate Bill 727 (2024), which expands their private school choice program while also making the first significant reforms to the MSFF in nearly 20 years. Most notably, the new WADA will phase in, over a five-year period, a weighted factor of both attendance and enrollment. The gradual shift to focus equally on attendance and enrollment is formulated as follows:
- Fiscal Year 2026 WADA = 0.9 (weighted attendance) + 0.1 (enrollment)
- Fiscal Year 2027 WADA = 0.8 (weighted attendance) + 0.2 (enrollment)
- Fiscal Year 2028 WADA = 0.7 (weighted attendance) + 0.3 (enrollment)
- Fiscal Year 2029 WADA = 0.6 (weighted attendance) + 0.4 (enrollment)
- Fiscal Year 2030 WADA = 0.5 (weighted attendance) + 0.5 (enrollment)
Additionally, Missouri is one of the few states that includes some early childhood education funding in its formula. Previously, students aged three to five who are eligible for FRL may be added to the school’s ADA up to a percentage not to exceed 4 percent of the total number of FRL-eligible students within the district or public charter school. The bill increased the upper limit of enrollment to 8 percent beginning in Fiscal Year 2026.⁵⁹
TABLE 8. Student Population Factors for Additional Weight
| Student Category | Student Population Threshold | Additional Per-Pupil Weight |
|---|---|---|
| Special Education Students with IEPs | >13.30 percent | 0.75 |
| Limited English Proficiency (LEP) Students | >2.09 percent | 0.60 |
| Students Receiving Free and Reduced Lunch (FRL) | >16.73 percent | 0.25 |
North Carolina
The Tar Heel State utilizes a hybrid, resource-based student funding formula. For the 2024-2025 school year, the base funding amount was $7,170 per pupil for Grades K-3, $6,027 per pupil for Grades 4-9, and $6,030 per pupil for Grades 8-12.⁶⁰ As Table 9 illustrates, this formula, like Alabama’s pre-2025 system, is based upon allotted salaries and school personnel as allotted per student population subtype. The system calculates ratios based on the Average Daily Membership (ADM), or the number of students enrolled.
TABLE 9. North Carolina School Funding Allotment Formula (2024-2025)
| Resource Category | Grade Level | Staff-to-Student ADM Ratio |
|---|---|---|
| Classroom Instructors/Teachers | Kindergarten | 1:18 |
| Grade 1 | 1:16 | |
| Grades 2 – 3 | 1:17 | |
| Grades 4 – 6 | 1:24 | |
| Grades 7 – 8 | 1:23 | |
| Grade 9 | 1:26.5 | |
| Grades 10 – 12 | 1:29 | |
| Math, Science, or Computer Teachers | − | 1 per county |
| Program Enhancement Teachers | Grades K – 5 | 1:191 |
| Teacher Assistants | Grades K – 3 | 1:21 |
| School Health Personnel | − | 1 per LEA plus 1:436.59 |
| Instructional Support | − | 1:417.12 |
| School Building Administration (pre-2011) | − | 1:≤100 or ≤7 employees |
| School Building Administration (post-2011) | − | 1:≤100 |
| Assistant Principals | − | 1:98.53 |
Additional funding is allotted based on the following expenses and/or student population categories, not including a textbook supplement of $37.12 per ADM for Grades K-12; an additional $31.51 per ADM for classroom materials, instructional supplies, and equipment; and a further $2.69 per ADM in Grades 8-9 for PSAT testing. The basis of these supplemental allotments for weighted categorical programs is explained in Table 10.
TABLE 10. North Carolina School Funding Weighted Categorical Programs (2024-2025)
| Student Category | Weighted Allotment (Per ADM) | Notes |
|---|---|---|
| Academically or Intellectually Gifted | $1,519.55 | Up to 4 percent of the ADM |
| At-Risk (Low-Income or Poverty) | $106.71 | An additional $534.40 per child as qualified per federal Title 1 Low Income Poverty data |
| Exceptional Needs Students† | $5,365.09 | Based on the child count, which is the lesser of the December 1 disabled student count or a cap of 13 percent of the ADM |
| Driver’s Education or Training (Grade 9) | $209.48 | Includes public, charter, private, and federal ADMs |
| Limited English Proficiency | Variable | 50 percent based on ELLs at $554.89 per ADM and the remainder for districts with ELL concentrations at $3,410.83 per ADM |
| Career-Technical Education Program Support | $40.00 | Initial funding of $10,000 per LEA, with the remainder based on ADM for Grades 8–12 |
† † For preschool-aged children with exceptional needs, a base of $78,421 per district with a supplement based on the December 1 estimated population at a weight of $5,528.06 per child.
The weights also allocate the equivalent of the salary of one school resource officer to districts, calculated as $89,671 for each high school for the 2024-2025 school year. Each Local Education Agency (LEA) also receives the minimum dollar equivalent of two teachers and two instructional support personnel—approximately $328,890—to account for at-risk student services personnel needs. Similarly, for ELLs with limited English proficiency, each school is allotted the dollar equivalent of a teaching assistant, which amounted to $46,272 for the most recent school year.⁶⁴
For sparsity, to supplement small county student funding, the state also allocates additional support based on the ADM ratio of lower population regions as follows:
- $1,820,000 for those with an ADM of less than 1,300
- $1,774,700 for those with an ADM of less than 1,700
- $1,729,400 for those with an ADM of less than 2,000
- $1,684,100 for those with an ADM of less than 2,300
- $1,638,800 for those with an ADM of less than 2,600
- $1,593,500 for those with an ADM of less than 2,800
- $1,548,200 for those with an ADM of less than 3,300⁶⁵
However, due to the resource-based funding approach, LEAs in North Carolina vary from slightly more than 400 ADMs to more than 160,000 ADMs, making comparing interdistrict or interstate funding levels challenging.⁶⁶
Further complicating the funding landscape in the Tar Heel State is the pending three-decade court case—Leandro v. State of North Carolina—which is currently awaiting an unprecedented fifth State Supreme Court ruling on the issue. The core of this 1994 lawsuit surrounds what legally constitutes a “sound, basic education” in a situation wherein complex funding formulas do not equitably share funds, which the plaintiffs argue leaves lower-income or rural school districts at a distinct disadvantage compared to wealthier districts, from its first ruling in 1997 to the currently awaited 2025 decision. The complexity of this case, and education funding formulas in general, is perhaps most evident as the docket in this case already surpassed 400 pages and more than 50 banker’s boxes of addenda by 2004.⁶⁷ According to a 2021 study by WestEd commissioned by the then-governor, at stake is more than $6 billion in new funding to improve equity, with an initial court-ordered start-up of more than $1.7 billion.⁶⁸ Considering the common constitutional language across states regarding the requirement to provide free and adequate public education, the fifth and possibly final court decision will have probable impacts expanding beyond the state.
Oklahoma
Like many other states nationwide, the Sooner State’s student-based funding formula has remained largely unchanged since its implementation in 1981. However, it provides supplements for student density to support transportation in rural districts, and a 2021 adjustment led to each school district receiving its initial allocation of state aid based on actual collected revenues, average student enrollment by grade level, pupil category counts, and transportation supplement data for the first nine weeks of the school year.⁶⁹
For the 2024-2025 school year, the base foundation aid was $2,127.80 plus a $104.31 teacher salary incentive for a prorated per-pupil base of $4,214—an increase of more than $360 from the prior year’s base.⁷⁰
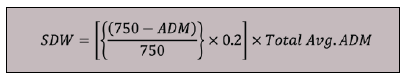
The statute also provides for a weighted district calculation to provide additional support to districts via two formulas, wherein the highest calculation is applied: the small school district formula and the district sparsity isolation formula.⁷¹ The small district weight (SDW) applies only to districts with an ADM of less than 750 students and is calculated as:
Similarly, the district sparsity isolation formula (DSI) applies only to districts with a total area greater than the average area in square miles for all school districts in the state and those with an areal density of less than one-fourth of the state’s average areal density.‡‡ The formula for the sparsity isolation weight is calculated as:
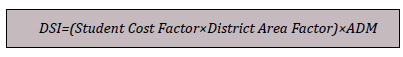
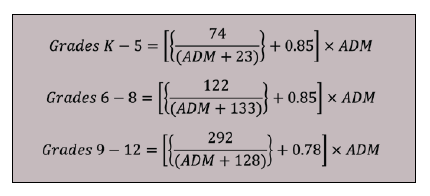
The two new measures used to calculate DSI—the student cost factor and the district area factor—also feature unique calculations.⁷² Specifically, the student cost factor is calculated by grade level as follows:
Whereas the district area factor is calculated as a school district’s area minus the state’s average district area, with the remainder divided by the state’s average district area.⁷³
State law permits the State Board of Education to define the geographical extent used to calculate the DSI factor, up to an additional area not exceeding 30 percent of the district’s actual size. Additionally, when districts are consolidated, the board may allow the new consolidated district to use the immediately preceding three years’ SDW for the unconsolidated districts.⁷⁴
‡‡ The statute defines areal density as the school district’s ADM divided by the district’s total area in square miles.
Further, Oklahoma is one of the few states in the region with distinct and nonexclusive student weights based on grade level and demographic or categorical designation, as illustrated in the table below.
TABLE 11. Oklahoma Statutory State Aid Per-Pupil Weights
| Grade Level and Student Population | Weighted Categories Per-Pupil Weight |
|---|---|
| Half-Day Early Childhood Programs / Pre-Kindergarten | 0.700 |
| Full-Day Early Childhood Programs / Pre-Kindergarten | 1.300 |
| Half-Day Kindergarten | 1.300 |
| Full-Day Kindergarten | 1.500 |
| Grades 1 – 2 | 1.351 |
| Grade 3 | 1.051 |
| Grades 4 – 6 | 1.000 |
| Grades 7 – 12 | 1.200 |
| Out-of-Home Placement Students §§ | 1.500 |
| Visual Impairment or Deaf-Blindness | 3.800 |
| Specified Learning Disability | 0.400 |
| Deafness or Hearing Impairment | 2.900 |
| Intellectual Disability | 1.300 |
| Emotional Disturbance | 2.500 |
| Multiple Disabilities or Impairments | 2.400 |
| Orthopedic Impairment | 1.200 |
| Speech or Language Impairment | 0.050 |
| Autism | 2.400 |
| Traumatic Brain Injury | 2.400 |
| Other Health Impairment | 1.200 |
| Gifted Students*** | 0.340 |
| Bilingual and English Language Learners | 0.250 |
| Special Education Summer Program Students | 1.200 |
| Economically Disadvantaged Students | 0.300 |
| Optional Extended School Year Program Students | Varies††† |
§ § If claimed, the out-of-home placement weight replaces the grade level and any other category weights for that student and is based upon the number of beds. For example, for a student residing in a juvenile detention center with fewer than 12 beds, the out-of-home placement weight is calculated as 3.0 for a center with six beds, 2.3 for a center with eight beds, and 1.80 for a center with 10 beds.
*** The number to be multiplied by the gifted weight is the lesser of: the sum of the number of students who scored in the top 3 percent on any national standardized test of intellectual ability plus the number of students identified as gifted, or the sum of the number of students who scored in the top 3 percent on any national standardized test of intellectual ability plus 8 percent of the total ADM of the school district for the first nine weeks
of the school year.
††† The State Board of Education determines the weights and factors for extended school programs based on a sliding weight scale from 0.0 to 0.20 to be determined based upon the number of special education students requiring extended school programs in the district, as well as the number of additional days needed for services.
An add-on, known as the transportation supplement, is based on the average daily haul—that is, the number of students in the district who live 1.5 miles or more from the school and are eligible for public school transportation—multiplied by the per capita allowance, as shown in the table below, and then multiplied by the formula transportation factor, weighted at 1.39.⁷⁶
TABLE 12. Oklahoma Statutory Transportation Supplement Factors
| Density Range | Per-Pupil Allowance | Density Range | Per-Pupil Allowance |
|---|---|---|---|
| 0.3000 – 0.3083 | $167 | 0.9334 – 0.9599 | $99 |
| 0.3084 – 0.3249 | $165 | 0.9600 – 0.9866 | $97 |
| 0.3250 – 0.3416 | $163 | 0.9867 – 1.1071 | $95 |
| 0.3417 – 0.3583 | $161 | 1.1072 – 1.3214 | $92 |
| 0.3584 – 0.3749 | $158 | 1.3215 – 1.5357 | $90 |
| 0.3750 – 0.3916 | $156 | 1.5358 – 1.7499 | $88 |
| 0.3917 – 0.4083 | $154 | 1.7500 – 1.9642 | $86 |
| 0.4084 – 0.4249 | $152 | 1.9643 – 2.1785 | $84 |
| 0.4250 – 0.4416 | $150 | 2.1786 – 2.3928 | $81 |
| 0.4417 – 0.4583 | $147 | 2.3929 – 2.6249 | $79 |
| 0.4584 – 0.4749 | $145 | 2.6250 – 2.8749 | $77 |
| 0.4750 – 0.4916 | $143 | 2.8750 – 3.1249 | $75 |
| 0.4917 – 0.5083 | $141 | 3.1250 – 3.3749 | $73 |
| 0.5084 – 0.5249 | $139 | 3.3750 – 3.6666 | $70 |
| 0.5250 – 0.5416 | $136 | 3.6667 – 3.9999 | $68 |
| 0.5417 – 0.5583 | $134 | 4.0000 – 4.3333 | $66 |
| 0.5584 – 0.5749 | $132 | 4.3334 – 4.6666 | $64 |
| 0.5750 – 0.5916 | $130 | 4.6667 – 4.9999 | $62 |
| 0.5917 – 0.6133 | $128 | 5.0000 – 5.5000 | $59 |
| 0.6134 – 0.6399 | $125 | 5.5001 – 6.0000 | $57 |
| 0.6400 – 0.6666 | $123 | 6.0001 – 6.5000 | $55 |
| 0.6667 – 0.6933 | $121 | 6.5001 – 7.0000 | $53 |
| 0.6934 – 0.7199 | $119 | 7.0001 – 7.3333 | $51 |
| 0.7200 – 0.7466 | $117 | 7.3334 – 7.6667 | $48 |
| 0.7467 – 0.7733 | $114 | 7.6668 – 8.0000 | $46 |
| 0.7734 – 0.7999 | $112 | 8.0001 – 8.3333 | $44 |
| 0.8000 – 0.8266 | $110 | 8.3334 – 8.6667 | $42 |
| 0.8267 – 0.8533 | $108 | 8.6668 – 9.0000 | $40 |
| 0.8534 – 0.8799 | $106 | 9.0001 – 9.3333 | $37 |
| 0.8800 – 0.9066 | $103 | 9.3334 – 9.6667 | $35 |
| 0.9067 – 0.9333 | $101 | 9.6668 or more | $33 |
South Carolina
The Palmetto State uses a hybrid student- and program-based funding formula, with a base amount of approximately $5,724 for the current academic year, according to the FY 2024-2025 General Appropriations bill’s average per pupil, for a total state contribution of $8,756.⁷⁸ South Carolina accounts for both student grade levels and student characteristics, such as enrollment in career programs or English-language learner status.⁷⁹
TABLE 13. South Carolina Public School Statutory Per-Pupil Grade and Category Weights
| Grade Level, Characteristic, or Program | Per-Pupil Weight |
|---|---|
| Kindergarten | 1.30 |
| Grades 1–3 | 1.24 |
| Grades 4–8 | 1.00 |
| Grades 9–12 | 1.25 |
| Exceptional Students I (Speech handicapped pupils) | 1.90 |
| Exceptional Students II (Educable mentally handicapped pupils and those with learning disabilities) | 1.74 |
| Exceptional Students III (Trainable mentally handicapped, emotionally handicapped, and orthopedically handicapped pupils) | 2.04 |
| Exceptional Students IV (Visually handicapped, hearing handicapped, and autistic pupils) | 2.57 |
| Homebound Students (Pupils residing in emergency shelters or residential treatment centers) | 2.10 |
| Pre-Career and Technology Students | 1.20 |
| Career and Technology Students | 1.29 |
Notably, students may only be counted under one of the 11 aforementioned weights. However, the statute provides add-on funding for three special categories: early childhood development and academic assistance at 0.26, academic assistance for Grades 4–12 at 0.114, and adult education programs weighted at 0.15.⁸¹
TABLE 14. South Carolina Charter School Per Pupil Classification Weightings (FY 2024-2025)
| Student Classification | Per-Pupil Weight |
|---|---|
| Youth Served in Licensed Residential Treatment Facilities | 2.10 |
| Students with Individualized Education Plans | 2.60 |
| Pre-Career and Career Technology Students | 1.20 |
| In-Person Charter School Students | 1.25 |
| Virtual or Distance Charter School Students | 0.65 |
| Gifted and Talented Students | 0.15 |
| Academic Assistance | 0.15 |
| Limited English Proficiency or Bilingual | 0.20 |
| Pupils in Poverty | 0.50 |
The state uses eligibility for Medicaid, SNAP, TANF, or classification as homeless, transient, or in foster care as its low-income or poverty indicator. Gifted and talented students are classified as academically or artistically gifted and talented, or enrolled in AP, IB, or Cambridge International courses in high school. Districts must also set aside at least 12 percent of the funds allocated for gifted and talented students for those in Grades 3 through 12. Students needing academic assistance are those not meeting state standards in mathematics, English language arts, or both, on state-approved assessments in elementary and middle school, or on high school assessments for Grades 9 through 12. Students are classified as having limited English proficiency when they require intensive English language instructional programs and when their families need specialized parental involvement intervention. These additional weights generate funding support for districts to provide individualized and supplemental instructional services to these students.⁸³
Tennessee
Before reforms in Alabama (2025) and Mississippi (2024), Tennessee was the only state in the region—and among a few nationally—to comprehensively revise and reform its decades-old funding formula. The Tennessee Investment in Student Achievement (TISA) Act of 2022 transitioned the state to a new student-based funding formula, with a combined appropriation of nearly $9 billion in state and local funds, plus an additional recurring $1 billion in state-invested appropriations. The formula—ranked from largest financial allocation to smallest—begins with a base amount ($7,075 for FY 2024–2025) covering foundational supports a student needs for a K–12 education. Weights for various unique learning needs or supports are added, followed by direct funding for external learning opportunities, with a final component providing incentives for outcomes and achievement milestones.⁸⁴
Per statute, the state is responsible for 70 percent of total funding allocations, including the base student funding amount and the non-mutually exclusive weighted individual student amounts, while the local share funds the remainder. The state fully covers all achievement incentives, specific learning opportunities, and fast-growing enrollment stipends—all of which are direct, non-weighted allocations.⁸⁵
TABLE 15. TISA Weighted Categories and Amounts (FY 2024-2025)
| Category / Classification(s) | Added Per Pupil Weight | Added Per Pupil Amount ($) |
|---|---|---|
| Economically Disadvantaged | 0.25 | 1,768.75 |
| Concentrated Poverty | 0.05 | 353.75 |
| Small-District | 0.05 | 353.75 |
| Sparsity | 0.05 | 353.75 |
| Unique Learning Need – Tier I (Least Impaired) | 0.15 | 1,061.25 |
| Unique Learning Need – Tier II | 0.20 | 1,415.00 |
| Unique Learning Need – Tier III | 0.40 | 2,830.00 |
| Unique Learning Need – Tier IV | 0.60 | 4,245.00 |
| Unique Learning Need – Tier V (Moderately Impaired) | 0.70 | 4,952.50 |
| Unique Learning Need – Tier VI | 0.75 | 5,306.25 |
| Unique Learning Need – Tier VII | 0.80 | 5,660.00 |
| Unique Learning Need – Tier VIII | 1.00 | 7,075.00 |
| Unique Learning Need – Tier IX | 1.25 | 8,843.75 |
| Unique Learning Need – Tier X (Most Impaired) | 1.50 | 10,612.50 |
| Kindergarten – Grade 3 Literacy Supplement | — | 500.00 |
| Grade 4 Supports | — | 500.00 |
| Career and Technical Education | — | 5,000.00 |
| ACT (per test) | — | 93.00 |
| Charter Supplement (estimated) | — | 500.00 |
For states considering such a widespread overhaul, it is notable that Tennessee engaged policymakers and stakeholders statewide through a central steering committee, 18 distinct subcommittees, public comment opportunities, local match funding discussions, and town halls.⁸⁸ Table 16 illustrates the scope of committees, convenings, and considerations involved in this process. Each committee reviewed public comments and made recommendations on policies or factors to include in the new funding formula. While all committee recommendations were considered and reported, the General Assembly had the final authority over what was ultimately incorporated into the legislative formula.⁸⁹
TABLE 16. Overview of TISA Strategizing Planning Groups (2021-2022)
| Committee / Subcommittee | No. of Members | Up to 4% of the ADM |
|---|---|---|
| Steering Committee | 12 | 3 |
| Funding Review Subcommittee | 18 | 4 |
| Student Engagement Subcommittee | 14 | 6 |
| Students with Disabilities and Gifted Students Subcommittee | 14 | 6 |
| English Learner Subcommittee | 11 | 6 |
| Economically Disadvantaged and Highly Mobile Students Subcommittee | 12 | 6 |
| Parent Choice and Voice Subcommittee | 22 | 6 |
| Teacher Advisory Subcommittee | 12 | 6 |
| Principal Advisory Subcommittee | 12 | 6 |
| School System Personnel Subcommittee | 13 | 6 |
| School System Leadership Subcommittee | 12 | 6 |
| Rural and Small District Subcommittee | 13 | 6 |
| Suburban Districts, Municipals, and Fast-Growing Communities Subcommittee | 13 | 6 |
| Urban District Subcommittee | 13 | 6 |
| Higher Education and Post-Secondary Readiness Subcommittee | 12 | 6 |
| Post-Secondary Readiness and the Business Community Subcommittee | 12 | 6 |
| Chambers of Commerce and Industry Subcommittee | 12 | 6 |
| Education Foundations Subcommittee | 10 | 6 |
| Regional Collectives and Advocacy Subcommittee | 11 | 6 |
| Fiscal Responsibility Subcommittee | 12 | 6 |
Texas
Funding for public schools in the Lone Star State comes from three primary sources: local property taxes, state appropriations, and federal grants or aid. The base per-student funding is provided through the Foundation School Program (FSP), which includes two main components—one for operations and one for facilities.⁹¹
For the 2024–2025 school year, the base allotment provided through state appropriations is $6,160 per student. This amount has remained flat since the 2019–2020 school year, when the last major reform to the formula occurred, and has increased by roughly 29.3 percent since the 2009–2010 school year, when it was $4,765.⁹²,⁹³
TABLE 17. Texas FSP Student Weights
| Category | Definition | Weight |
|---|---|---|
| Career and Technology (Tier I) | Used for a student who is in CTE courses, but not in an approved program of study. | 1.100 |
| Career and Technology (Tier II) | Defines a student in an approved program of study and enrolled in levels one and two CTE courses. | 1.280 |
| Career and Technology (Tier III) | Used for a student in an approved program of study and enrolled in levels three and four CTE courses. | 1.470 |
| Special Education (Homebound) | A student confined at home or hospital bedside for at least four consecutive weeks for medical reasons only, and documented by a licensed physician. | 5.000 |
| Special Education (Hospital Class) | Students who are provided special education instruction in a hospital facility or a residential care and treatment facility that is not operated by a school district. | 3.000 |
| Special Education (Speech Therapy) | If the only special education provided to a student with a documented disability is individualized instruction at no cost to the parents, tailored to meet the student’s unique needs. | 5.000 |
| Special Education (Resource Room) | Any student who attends at least three special education classes in a resource room. | 3.000 |
| Special Education (Self-Contained) | Students received instruction on a departmentalized campus, attending four or more special and at least three general education classes each school day. | 3.000 |
| Special Education (Off-Home Campus) | A student with a documented disability served in, but not residing in, a service or treatment facility. | 2.700 |
| Special Education (Vocational Adjustment Class) | Defined as any student who works half the school day and attends special education classes for the remainder. | 2.300 |
| Special Education (State School) | Youth receiving instruction at a state or state residential school. | 2.800 |
| Special Education (Residential Care and Treatment Facility) | Students who reside in and receive instruction in a residential treatment facility. | 4.000 |
| Special Education (Mainstream) | Those whose IEP permits special education and related services in the general classroom. | 1.150 |
| Other Special Education (Gifted or Talented) | Students in a recognized gifted and/or talented program of study for exceptional students. | 0.070 |
| Other Special Education (Bilingual Education) | A varied weight for students with an instructional arrangement used for those of limited English proficiency (LEP). | Varies‡‡‡ |
| Other Special Education (Dyslexia or Related Disorder) | Defined as those receiving services for dyslexia or a related learning disorder through special education or other state board-approved instructional criteria. | 0.100 |
| Other Special Education (Early Education) | Students in K-Grade 3 and educationally disadvantaged or emergent bilingual students in a special or bilingual education program. | 0.100 |
| Compensatory Education (Residential Placement / Non-Disadvantaged) | Those students who do not have a disability but reside in a residential placement facility in a district where the student’s parent or legal guardian does not reside. | 0.200 |
| Compensatory Education (Economically Disadvantaged) | Students who qualify as educationally disadvantaged and reside in an economically disadvantaged census block group. | Varies§§§ |
| Compensatory Education (Homeless) | Youth or child classified as unhoused or transitory. | 0.275 |
| Compensatory Education (Pregnancy-related) | A student who receives support services, including compensatory home instruction, during pregnancy, prenatal, and postpartum periods, to assist in adjusting to the academic, mental, and physical barriers to staying in school. | 2.410 |
‡‡‡ An LEP student who is provided bilingual education and special language programs receives a weight of 0.10 with an additional 0.05 weight for students using a dual language immersion/one-way or two-way program model. A 0.05 weight is also available for non-LEP students participating in a dual language immersion two-way program.
§§§ For economically disadvantaged students, the weights are assigned to five tiers from least to most severe economic disadvantage: 0.2250, 0.2375, 0.2500, 0.2625, and 0.2750.
More recently, lawmakers approved House Bill 2 (2025), which would increase the base per-pupil funding by $55 beginning next school year.⁹⁵ This increase is significantly lower than the initial proposal, which would have added more than $350 per pupil, or the more than $1,300 per pupil requested by school officials to address over five years of stagnant funding. While the bill has not yet been enacted, the governor has indicated his intent to sign it into law.⁹⁶
Virginia
The Commonwealth’s 50-year-old school funding formula—the Virginia Standards of Quality (SOQ)—uses the Local Composite Index (LCI) to determine each locality’s ability to contribute to K–12 public education within its borders. The LCI establishes the local and state share of SOQ formula funding, meaning the state covers a larger portion of the cost for school divisions in less wealthy localities and a smaller portion for divisions in wealthier areas. The SOQ calculates the number of staff positions needed for each division and applies cost assumptions to estimate the total cost of K–12 staff. Using the LCI, this cost is then apportioned between the state and each local government. However, the underlying weights and formulas have changed little since the 1970s.⁹⁷
Policymakers are increasingly considering the use of “revenue capacity” as an alternative approach to more accurately and fairly measure local ability to pay. The SOQ currently employs a 50-40-10 weighted split among LCI factors, adjusted biannually to maintain a statewide average of a 55:45 state-to-local funding ratio. Some lawmakers have proposed shifting LCI adjustments to a triennial schedule to save state funds, while others have suggested a complete rewrite of the SOQ.⁹⁸
As a resource-based model, the SOQ sets the statutory framework for the number of full-time equivalent (FTE) positions funded for public schools. Excepting librarians, special education teachers, school counselors, and other staff, funding ratios by grade level are specified. For example, kindergarten classes with an ADM above 24 students receive funding for a full-time teacher’s aide.⁹⁹ Middle and high school ratios do not have a statutory class-size maximum; districts must notify parents or guardians if a class exceeds the ratio and assign full-time instructional staff to achieve a schoolwide student-to-teacher ratio of 21:1 based on ADM.¹⁰⁰
FIGURE 10. Virginia Joint Legislative Audit and Review Commission (JLARC) Analysis of the SOQ Formula
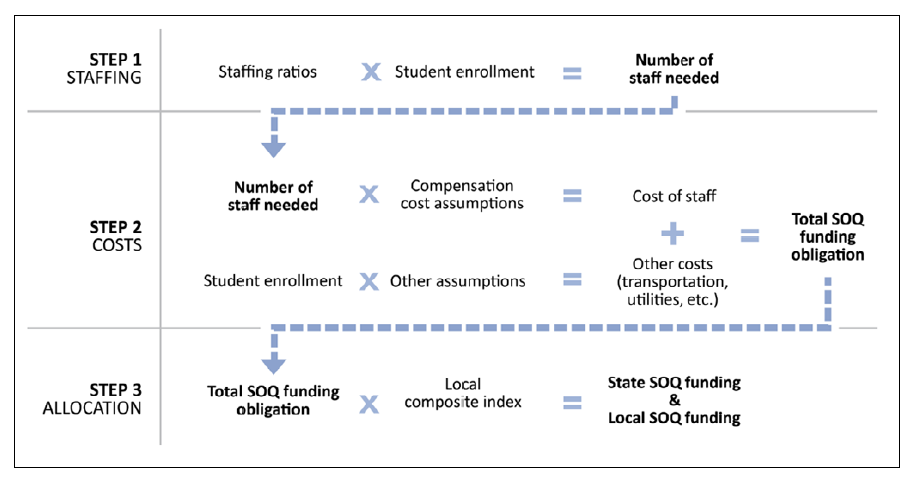
TABLE 18. Virginia SOQ Maximum and Minimum Resource-to-Pupil Ratios (2024-2026)
| Grade Level / Category | Funded Student-to-Staff Ratio | Max Funded Class Size |
|---|---|---|
| Kindergarten | 24-to-1 | 29 students |
| Grades 1–3 | 24-to-1 | 30 students |
| Grades 4–6 | 25-to-1 | 35 students |
| Grades 6–12 (English classes) | 24-to-1 | — |
| Middle Schoolwide (Grades 6–8) | 21-to-1 | — |
| High Schoolwide (Grades 9–12) | 21-to-1 | — |
| K–12 Professional Instructors and Aides (Districtwide) | 1,000-to-51 | — |
| Special Education (Schoolwide) | 1,000-to-1 | — |
| Speech Pathologists (Schoolwide) | 68-to-1 | — |
| CTE and Additional Special Education Support (Schoolwide) | 1,000-to-6 | — |
| Elementary Resource Teachers (Schoolwide) | 1,000-to-5 | — |
| Support Technology Staff (Schoolwide) | 1,000-to-1 | — |
| Instructional Technology Staff (Schoolwide) | 1,000-to-1 | — |
| Instructional Support Staff (First FY of Biennial Budget) | 1,000-to-24 | — |
| Instructional Support Staff (Second FY of Biennial Budget) | 1,000-to-27.89 | — |
| Standards of Learning Mathematics Readiness Instructors | 1,000-to-1 | — |
| Qualifying Free and Reduced Lunch Program (FRLP) | ||
| Grades K–3 (30%–45% three-year average) | 19-to-1 | 24 students |
| Grades K–3 (45%–55% three-year average) | 18-to-1 | 23 students |
| Grades K–3 (55%–65% three-year average) | 17-to-1 | 22 students |
| Grades K–3 (65%–70% three-year average) | 16-to-1 | 21 students |
| Grades K–3 (70%–75% three-year average) | 15-to-1 | 20 students |
| Grades K–3 (75% or more three-year average) | 14-to-1 | 19 students |
| Required Instructional Staff for English Language Learner Programs | ||
| EL Student Proficiency – Level I | 20-to-1 | — |
| EL Student Proficiency – Level II | 30-to-1 | — |
| EL Student Proficiency – Level III | 40-to-1 | — |
| EL Student Proficiency – Level IV | 50-to-1 | — |
| EL Student Proficiency – All Other Categories | 100-to-1 | — |
The biennial appropriations act also sets the funding levels and weights for upcoming academic years. The 2024–2026 Budget Bill allocates up to 0.5 FTE per pupil (0.25 per qualifying course) for students enrolled part-time in public schools from nonpublic or homeschool settings in any math, science, English, history, social science, vocational education, health or physical education, fine arts, or foreign language course, as well as for students receiving special education under an IEP. Localities with adjusted gross income comprising 3 percent or more of nonresident income are not required to include nonresident figures when computing their local share under the LCI formula. An additional per-pupil supplement of $160.14 annually is appropriated to cover the state’s share of textbook costs.¹⁰⁴
Most recently, in 2023, the Joint Legislative Audit and Review Commission (JLARC) conducted a study of the SOQ at the General Assembly’s request. The study found that a comprehensive overhaul would cost millions in both the short and long term but would shift the staffing-based formula to a more common and effective student-based model. Because the formula still reflects cost reductions from the Great Recession, the difference between actual K–12 staff compensation and SOQ estimates is approximately $1.3 billion, with a large district spending nearly $139 million more than the SOQ projection.¹⁰⁷
Additionally, JLARC staff theorized that the state should provide 66 to 93 percent more funding than the current SOQ provides. On average, Virginia underfunds its school divisions by more than 14 percent per student, or roughly $1,900 per student.¹⁰⁸
TABLE 19. Virginia Budget Bill Add-On Weights for Supplemental Funds (2024-2026)
| Student Category | Added Per-Pupil Weight |
|---|---|
| Special Education – Tier I | 4.75 |
| Special Education – Tier II | 5.25 |
| At-Risk (Includes ELLs)**** | 11.0 |
**** Additionally, the state may provide a share of up to 37.0 percent to a school division to support at-risk students based upon a locality’s concentration of such pupils compared to neighboring geographies.
West Virginia
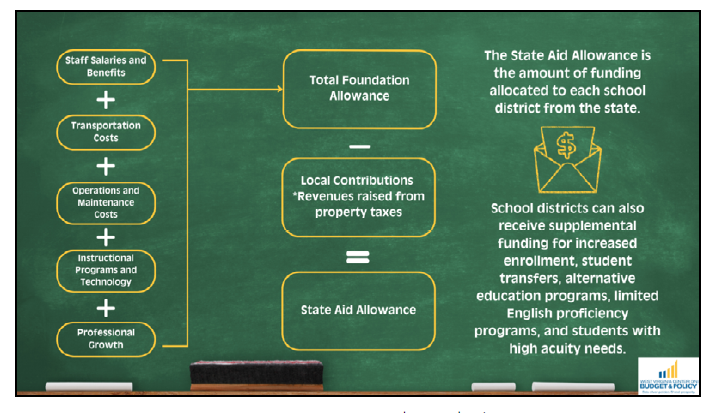
Like its neighbor, West Virginia also utilizes a resource-based funding formula where $8 of every $10 comes from state and local support. The formula – entitled the Public School Support Program (PSSP) – determines the cost of providing education based on the cost of resources, including staffing, transportation, operations and maintenance, instructional programs, technology, and professional growth, and according to the number of students enrolled in the school district. The state allocates a total funding amount for each district based on estimates of how many instructors and other staff are needed and staff salaries, given the number and type of students they serve.¹⁰⁹
FIGURE 11. Infographic of West Virginia Public School Funding Method
The state also divides its 55 districts into categories based on net student enrollment per square mile for PSSP calculations:
- Sparse: Less than five students per square mile;
- Low: Five to less than 10 students per square mile;
- Medium: 10 to less than 20 students per square mile; and
- High: 20 or more students per square mile.¹¹⁰
For the 2024-2025 school year, approximately 40 percent, or 22 districts, qualified as sparse; 14 districts, or 25 percent, were deemed low enrollment; just under 11 percent, or six districts, were medium density; and 23 percent were considered high-density districts.¹¹¹
State code also applies a foundation allowance based upon county density for school district transportation costs, with the state’s share being 87.5 percent for high-density, 90.0 percent for medium-density, 92.5 percent for low-density, and 95.0 percent for sparse-density counties. Any counties that are part of a multijurisdictional vocational center are eligible for an extra 10 percent to cover shared costs. Notably, the resource-based formula also provides for an additional 10 to 15 percent for any county school bus system that operates using alternative fuels and contains parts made or assembled in West Virginia.¹¹⁴ In addition to this resource base, districts also receive allowances for specific student categories, including:
- Increased enrollment allowance equal to the increase in net enrollment from the prior school year multiplied by the state’s average per pupil aid;
- Alternative education programs allowance of $18 per net student enrollment; and
- A Limited English Proficiency allowance at an unspecified and non-statutory designated amount; instead, districts must apply to the state board for funds if the LEP instructional needs exceed the district’s financial capabilities to provide.¹¹⁵
Similarly to the Commonwealth’s LCI, West Virginia’s local share is computed by taking each district’s typical property tax levies each year by using 85 percent of the taxable assessed valuation of properties located within the district’s levy, with a 4 percent deduction for discounts and delinquencies. Preliminary calculations are made each December using state estimates, with specific levy rates set for different property classes. The local share is based on the initial valuation for projects with tax increment financing. In growth counties, revenues from new properties are deducted. Additionally, 10 percent of the growth in local share funds is designated for instructional program supports, 20 percent for instructional technology, and another 20 percent allocated for teacher development and professional growth. The local share is then subtracted from the state’s foundation allowance to determine its funding contribution.¹¹⁶
TABLE 20. PSSP Foundation Allowance for Staff and Instructional Personnel††††
| Staff, Personnel, or Resource Role | Staffing Ratio | Qualifying Area |
|---|---|---|
| Professional Educators | 1,000 pupils-to-72.30 educators | High-Density County |
| 1,000 pupils-to-72.45 educators | Medium-Density County | |
| 1,000 pupils-to-72.60 educators | Low-Density County | |
| 1,000 pupils-to-72.75 educators | Sparse-Density County | |
| Professional Instructional Personnel | 91.29 personnel-to-1 educator | High-Density County |
| 91.24 personnel-to-1 educator | Medium-Density County | |
| 91.18 personnel-to-1 educator | Low-Density County | |
| 91.07 personnel-to-1 educator | Sparse-Density County | |
| Professional Service Staff | 1,000 pupils-to-50.65 service staff | High-Density County |
| 1,000 pupils-to-51.21 service staff | Medium-Density County | |
| 1,000 pupils-to-51.78 service staff | Low-Density County | |
| 1,000 pupils-to-52.36 service staff | Sparse-Density County | |
| Professional Student Support Staff | 1,000 pupils-to-5 support staff | – |
†††† State code defines professional educators as synonymous with teachers and professional instructional personnel as any professional educator whose regular duties are those of a classroom teacher, librarian, attendance director, or school psychologist. Professional student support personnel is the term for a teacher or personnel whose primary duty is that of a counselor or school nurse.
Waiting for the Other Shoe to Drop: Considering Federal Funding Impacts
As previously noted, federal sources are a relatively small portion of the overall funding share for public education; their impact varies among states in the South. From a high of 23.4 percent of all public K-12 funding in Mississippi to a low of 11.5 percent in Virginia, the importance of federal supplemental revenues cannot be overstated. On average, the 15 CSG South member states relied more heavily on state share (43.1 percent) than local (39.9 percent), with a not inconsequential federal share of 16.9 percent.¹¹⁸ Interestingly, Arkansas, with the highest state share of more than 66 percent, is nearly double the state share of Texas, with the lowest percentage (approximately 28 percent). Unsurprisingly, these two states are flipped in terms of local share, with Texas’s education funding relying on more than 55 percent on local revenues as opposed to Arkansas, where local funding is less than 15 percent of the total education funding system.¹¹⁹
TABLE 21. Comparison of Southern State K-12 Education Funding System Sources (FY 2023)
| State | Federal Share | State Share | Local Share |
|---|---|---|---|
| Alabama | 16.9% | 51.6% | 31.5% |
| Arkansas | 19.2% | 66.3% | 14.5% |
| Florida | 17.0% | 31.2% | 51.8% |
| Georgia | 13.2% | 38.8% | 48.0% |
| Kentucky | 17.2% | 49.3% | 33.5% |
| Louisiana | 19.3% | 33.8% | 46.9% |
| Mississippi | 23.4% | 45.0% | 31.6% |
| Missouri | 13.6% | 34.8% | 51.6% |
| North Carolina | 18.3% | 55.9% | 25.7% |
| Oklahoma | 16.5% | 42.0% | 41.5% |
| South Carolina | 13.9% | 42.7% | 43.3% |
| Tennessee | 18.3% | 39.7% | 42.0% |
| Texas | 16.8% | 28.1% | 55.0% |
| Virginia | 11.5% | 40.7% | 47.7% |
| West Virginia | 18.8% | 46.8% | 34.4% |
| CSG South Average | 16.9% | 43.1% | 39.9% |
FIGURE 12. Federal Share Percentage as Education Funding Source for States’ Public Education Finance System
(FY 2023)
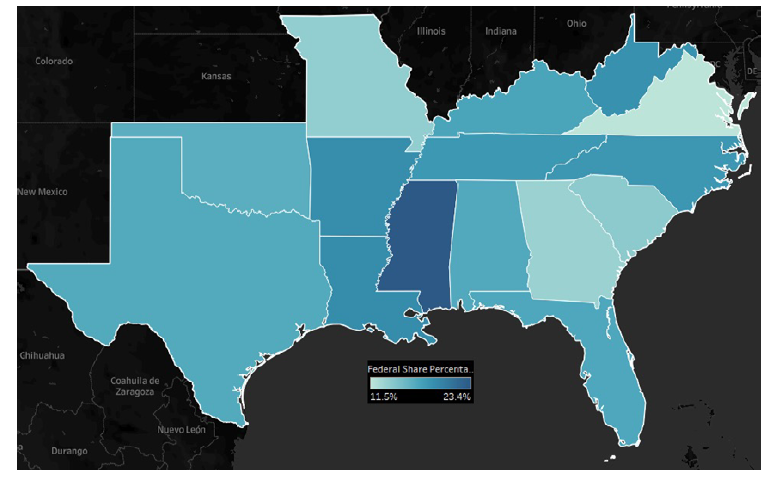
FIGURE 13. State Share Percentage as Education Funding Source for States’ Public Education Finance System (FY 2023)
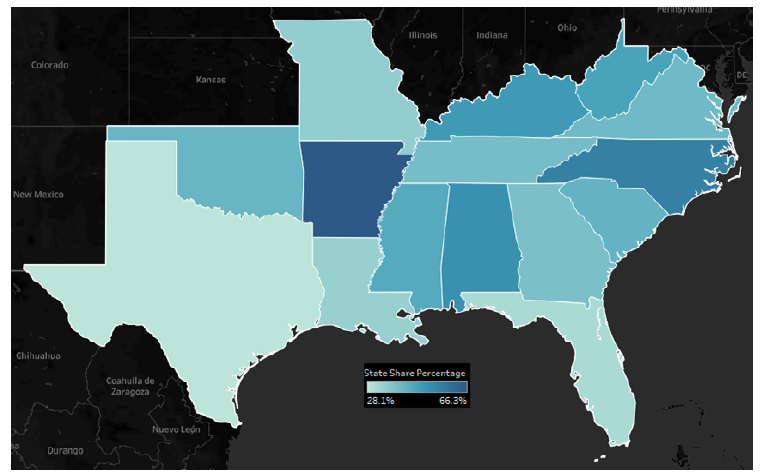
FIGURE 14. Local Share Percentage as Education Funding Source for States’ Public Education Finance System (FY 2023)
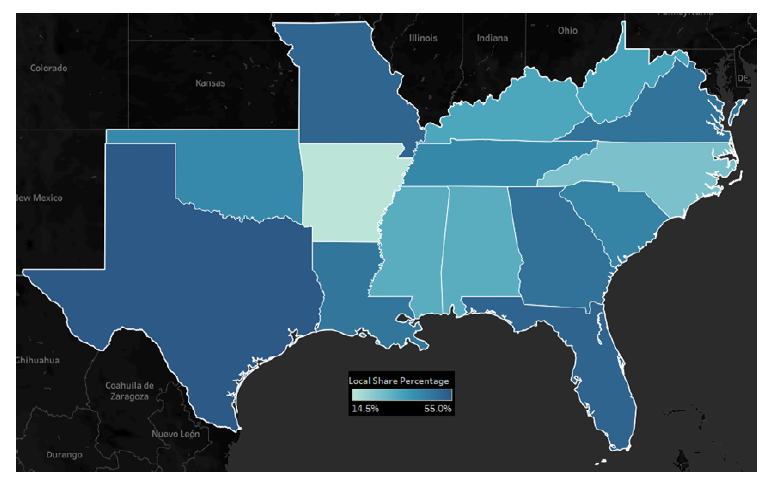
Particularly noteworthy is the recent testimony by U.S. Secretary of Education Linda McMahon in support of the White House’s Fiscal Year 2026 Budget Request for the U.S. Department of Education, which would decrease the department’s funding by more than 15 percent as part of a gradual step-down towards the department’s dissolution.¹²³ Additionally, the federal termination of Education Stabilization Funds, including the Elementary and Secondary School Emergency Relief Fund (ESSER) – if held by the courts – may have a widespread impact on states as the previously approved extension to use these relief funds could result in a loss of access to more than $1 billion in federal funds. As of May 2025, a coalition of 16 states plus the District of Columbia has successfully enjoined the cancellation of these ESSER funds.‡‡‡‡ However, the relief only applies to those states that joined the suit. Nevertheless, the cancellation or holding of the ESSER extension could impact states beyond those that are parties to the suit.¹²⁴ For example, in April 2025, the Mississippi State Superintendent wrote a letter to Secretary McMahon regarding the more than $137 million in unspent ESSER funds that were earmarked for supporting homeless students and COVID-related learning loss would be impacted by the cancelled extension.¹²⁵
†††† No states within the CSG South region are parties to the suit.
TABLE 22. Comparison of State Unspent ESSER Funds Impacted by Federal Cuts
| States with the Most Unspent ESSER Funds | Amount | States with the Least Unspent ESSER Funds | Amount |
|---|---|---|---|
| 1. Pennsylvania | $254,278,893 | 1. Hawai’i | $18,000 |
| 2. Texas | $242,533,288 | 2. Alabama | $1,412,349 |
| 3. Maryland | $240,888,055 | 3. Alaska | $1,439,557 |
| 4. New York | $178,682,180 | 4. Wisconsin | $1,448,353 |
| 5. Florida | $150,955,645 | 5. Rhode Island | $2,248,707 |
| 6. Ohio | $137,270,930 | 6. South Dakota | $3,129,604 |
| 7. Tennessee | $136,009,439 | 7. Wyoming | $4,024,657 |
| 8. Mississippi | $132,435,579 | 8. North Dakota | $4,282,716 |
| 9. Massachusetts | $124,118,901 | 9. Oregon | $4,616,054 |
| 10. New Jersey | $110,876,421 | 10. Iowa | $5,840,840 |
Of course, these questions are preliminary, as despite significant and often contradicting statements in D.C., concrete action to close the federal Department of Education or comprehensively transform the processes by which states rely on federal support for high-need student populations has yet to be enacted or pass judicial muster. However, as state lawmakers focus on rewriting decades-old models, they may also wish to consider the potential impacts of changes to federal funding structures, amounts, or other actions. A potential federal pullback presents a critical opportunity for states to take the lead, but they must be ready and willing to step up and fill the void that federal funding has long provided as the once-in-a-lifetime ESSER windfall dries up.
Conclusion
School funding – much like high school math – can appear to be an overwhelmingly complex and terrifying subject. As such, it should come as no surprise that comprehensive rewrites of these funding formulas have taken decades, at minimum, to change or have yet to be reformed at all. To illustrate this point, according to the Learning Policy Institute, since 2000, only nine states have rewritten or substantially reformed their education funding formulas.¹²⁷ However, the examples of states both inside and outside the South, such as Alabama, Colorado, Maryland, Mississippi, Nevada, and Tennessee, that recently undertook multiyear projects to rewrite their formula demonstrate that it can be done, just not immediately.¹²⁸
In addition to funding traditional K-12 public schools, states are also engaged in the financial support and oversight of other educational programs such as early childhood programs, prekindergarten, charter schools, various choice measures, and other nonstandard methods. As such, policymakers should not be discouraged by the complexity or scale of this issue and, instead, begin the multiyear work of education finance modernization as soon as possible to ensure this issue is not left for the next generation to tackle.
Regarding what to do now, state leaders may wish to follow the approaches in the aforementioned states, where multiyear study convenings and stakeholder meetings developed a comprehensive strategy. Alternatively, some researchers, such as those at the Lincoln Institute of Land Policy, have suggested pursuing an alternative funding source to break the stranglehold local property taxes have on education funding inequities by considering local option sales or income taxes and reforming state aid to account for disparities more holistically. For example, Virginia includes a state-level $0.01 sales and use tax levy earmarked for public education funding while Georgia permits local.¹²⁹ Regardless, like solving for Π, the formula for public education will continue to grow and is not an issue that can be solved permanently or instantaneously.
FIGURE 15. Alternatives to Local Property Taxes for Public Education Financing (2022)
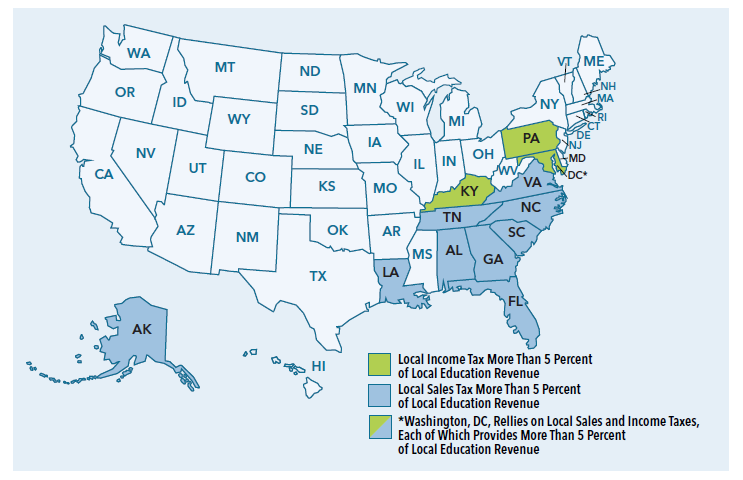
Glossary
While every state functions slightly differently, several terms are commonly used or referred to across the board—including in this report—and are defined below with the assistance of the U.S. Census Bureau Annual Survey of School System Finances, Center for Charter Schools at Central Michigan University, The Lincoln Institute of Land Policy’s Property Tax At-A-Glance, and the National Center for Education Statistics.
- Ad Valorem Tax: A tax based on the value of the item being taxed, usually expressed as a percentage of the value. For the most part, the property tax is an ad valorem tax.
- Advanced Placement (AP): Standardized exams covering a variety of subjects for which students may receive college credit for qualifying scores. Often used as a metric to gauge the number of gifted students for states that utilize that characteristic in their funding formulas.
- Assessment Ratio: The percentage of a property’s market value that is used to determine its assessed value.
- Average Daily Attendance (ADA): The count of the total number of students present at school on a given day.
- Average Daily Membership (ADM): The total number of students enrolled or registered to attend a school at a given time.
- English Language Learners (ELL): Students in the process of learning English, who are not fluent and may be at varying proficiency levels. Also referred to as English for Speakers of Other Languages (ESOL), English as a Second Language (ESL), Limited English Proficiency (LEP), or Bilingual students.
- Equalization: A process by which a government attempts to ensure that all property under its jurisdiction is assessed at the same assessment ratio or the ratio or ratios required by law. For example, a state may conduct equalization among multiple school districts so that its state aid payments, which depend on property value per pupil, are calculated equitably.
- Foundation Aid: A form of school aid that ensures that per-pupil expenditure meets or exceeds a certain minimum in all districts by filling the gap between the foundation amount and the amount of funding a district can provide by setting a particular tax rate. Also referred to as foundation funding.
- Free and Reduced-Price Lunch (FRL or FRPL): The federal program that reimburses school districts for providing meals to low-income students. The threshold for free lunch is a household income at or below 130 percent of the federal poverty line. The threshold for reduced-price lunch is a household income at or below 185 percent of the federal poverty line. FRPL is the most used proxy for determining levels of poverty in student populations.
- Full Time Equivalent (FTE): A measure of how much time a student receives specialized instruction through a program, regardless of where the student receives instruction.
- Hold Harmless: In school finance, a term used to describe a policy provision that prevents a school district or municipality from receiving less funding than it otherwise would receive under a statutory formula.
- International Baccalaureate (IB): An internationally recognized, rigorous curriculum for which high school graduates may receive college credit for completing an IB program or passing certain IB end-of-course exams. Like with AP examinations, participation or enrollment in IB programs or courses is often used to calculate the number of gifted students for funding purposes.
- Local Education Agency (LEA): While sometimes referenced as Educational Service Agencies (ESAs), these are the public board of education or other public authority legally constituted within a state to either administer or direct or perform a service function for public elementary or secondary schools in a city, county, township, school district, or other political subdivision of a state. Regional Educational Service Agencies (RESAs) and state charter schools are each their own LEA.
- Supplemental Nutrition Assistance Program (SNAP): A federal program providing food benefits to low-income families that is used in education funding as a measure of individual or regional poverty.
- Mills: Units equal to one-thousandth of one dollar, or one-tenth of one cent. Property tax owed is computed by multiplying each $1,000 in assessed value by the mill levy. For example, the property tax bill for a $200,000 home in a town with a mill levy of 9 would be $1,800 (200 * 9).
- Taxing Unit: Any political unit of a state that imposes property taxes, such as counties, municipalities, school districts, and special districts.
- Temporary Assistance for Needy Families (TANF): A federal block grant program that provides assistance to low-income families with children, typically used by states to fit their individual needs for support such as job training, childcare, transportation, or cash assistance. Like SNAP and FRLP, it is used by many states’ funding formulas as a metric to measure poverty levels across districts or schools.
End Notes
- “Funded: A National Overview of State Education Funding Policies,” EdBuild, 2025.
- “U.S. School System Current Spending Per Pupil by Region: Fiscal Year 2023,” U.S. Census Bureau, May 1, 2025.
- Daphne Kenyon, et al., “Rethinking the Property Tax-School Funding Dilemma,” The Lincoln Institute of Land Policy, November 2022.
- “Composite Index of Local Ability-to-Pay,” Va. Department of Education (2025).
- “Funded: A National Overview…,” EdBuild.
- Ibid.
- Ibid.
- Ibid.
- “Local Composite Index,” Human Development and Education Committee Presentation, Virginia Municipal League (2015).
- Danielle Farrie and Robert Kim, “Making the Grade 2023,” Education Law Center, December 11, 2023.
- Howie Knoff, “The Impact of Inequitable School Funding: Solutions for Struggling Schools Without the Money to Fully Help Struggling Students,” Equity & Access, American Consortium for Equity in Education, updated August 2024.
- “The Adequacy and Fairness of State School Finance Systems,” School Finance Indicators Project at Rutgers University and the University of Miami (Florida), Sixth Edition, January 2024.
- Randy Rieland, “Public schools budget: The LCI hurdle,” Rappahannock News, March 27, 2023.
- “Composite Index…” VDOE.
- “Rethinking the Property Tax-School Funding Dilemma,” The Lincoln Institute of Land Policy.
- Ibid.
- U.S. Department of Education, National Center for Education Statistics, Common Core of Data (CCD), “National Public Education Financial Survey,” 2020-21. (This table was prepared August 2023.)
- “U.S. School System Current Spending…FY2023,” Census Bureau, 2025.
- Alabama Code § 16-13-231 (2024).
- Ala. Senate Bill 112 (2025).
- Ala. Senate Bill 305 (2025).
- Ibid.
- Arkansas Code Annotated § 6-20-2305 (2024).
- Ark. Senate Bill 294 (2023).
- Dr. Eric Saunders, “Arkansas School Funding Guide 2024-2025: Fiscal Services and Support,” Ark. Department of Elementary and Secondary Education, published 2024.
- Ark. SB 294 (2023).
- Florida Statute § 1011.62 (2024).
- “2024-2025 Funding Book,” Fla. Department of Education.
- Ibid.
- Fla. House Bill 5101 (2024).
- “House Staff Final Bill Analysis: HB 5101,” June 14, 2024.
- “2024-25 Funding Book,” Fla. Dept. of Edu.
- Georgia. Code § 20-2-180, et al.
- Ross Williams, “Georgia’s state school funding formula could finally take community’s poverty into account,” Georgia Recorder, March 13, 2025.
- Ga. Code § 20-2-180, et al.
- “QBE – Reports: FY 2025,” Ga. Department of Education.
- Jeff Amy, “Georgia budget proposes spending more on poor students for the first time,” Associated Press, March 11, 2025.
- Ga. House Budget and Research Office, “Fiscal Year 2026 Budget: House Bill 68 – Conference Committee Highlights.”
- Kentucky Revised Statutes 157.320.
- “SEEK Calculations: 2024-2025,” Ky. Department of Education.
- 720 Ky. Admin. Rules 3:270.
- Ky. House Bill 499 (2025).
- “MFP Presentation,” Louisiana Department of Education, June 2024.
- “2024-2025 MFP,” La. Board of Elementary and Secondary Education.
- La. Const. Art. VIII, Sec. 13.
- “MFP Presentation,” La. Dept. of Ed., June 2024.
- “MFP,” La. Dept. of Ed.
- Ibid.
- Dr. Felicia Gavin, “Mississippi Student Funding Formula,” Mississippi Department of Education, July 9, 2024.
- Miss. House Bill 4130 (2024).
- Miss. Code § 37-151-200, et al.
- Dr. Felicia Gavin, “Mississippi Student Funding Formula,” Miss. Department of Education, July 9, 2024.
- Frank Corder and Jeremy Pittari, “Could new education funding formula cost the state more than predicted?” Magnolia Tribune, August 13, 2024.
- Missouri Senate Bill 287 (2005).
- “Basic Formula Actual Payments,” Mo. Dept. of Elementary and Secondary Education, March 20, 2025.
- Mo. Rev. Stat. § 163.011.
- “Missouri School Funding Formula for FY 2026 and Beyond,” Mo. DESE, updated 2025.
- Ibid.
- Mo. SB 727 (2024).
- “Highlights of the North Carolina Public School Budget,” North Carolina Department of Public Instruction, March 2025.
- N.C. General Statutes § 115C-301.
- N.C. DPI.
- Ibid.
- Ibid.
- Ibid.
- Ibid.
- James Farrell, “For North Carolina schools, a 31-year wait for court-ordered funding through Leandro,” WUNC, February 12, 2025.
- “Summary of the Leandro Comprehensive Remedial Plan,” Prepared for the Commission on Access to Sound Basic Education, Office of the Governor, June 29, 2021.
- Oklahoma Statutes § 18-200.1.
- “State Funding Formula and Factors,” Okla. Department of Education, updated May 29, 2025.
- 70 O.S. § 18-201.1(B)(3)(a).
- Ibid.
- Ibid.
- Ibid.
- 70 O.S. § 18-201.1(B)(1)-(2).
- 70 O.S. § 18-200.1(D)(2).
- Ibid.
- South Carolina House Bill 630 (2024).
- S.C. Code § 59-20-40.
- Ibid.
- Ibid.
- “2024-2025 Funding Manual,” Chief Finance Office, S.C. Department of Education, published July 2024.
- Ibid.
- Tennessee House Bill 2143 (2022).
- Tennessee Code § 49-3-109.
- Tenn. Code § 49-3-105.
- “2024-25 School Year TISA Guide,” Tenn. Department of Education, updated January 6, 2025.
- “TISA Archives,” Tenn. Department of Education, 2022.
- Sam Pearcy and Eve Carney, “Tennessee Funding Review Engagement,” TNDOE, December 2021.
- Ibid.
- Texas Education Code Sec. 48.002.
- Tex. House Bill 3 (2019).
- “Basic Allotment,” Office of School Finance, Tex. Education Agency, updated October 2024.
- “Weighted Student Funding,” TEA, updated October 2024.
- Tex. HB 2 (2025).
- Jaden Edison, “Texas Legislature approves $8.5 billion boost for public schools after years of stagnant funding,” The Texas Tribune, May 29, 2025.
- Virginia Code § 22.1-97 (2025).
- “Composite Index…” VDOE (2025).
- Va. Code § 22.1-253.13:2.
- Ibid.
- “Virginia’s K-12 Funding Formula: Report to the Governor and General Assembly,” JLARC, July 10, 2023.
- Ibid.
- Va. House Bill 1600 (2025).
- Ibid.